Track quiz performance with Google Analytics
Google Analytics is a very useful tool for understanding customer behavior.
Connect quiz to Google Analytics
You can add your Google Analytics Tracking Code to your quiz to understand how your customers are interacting with your quiz, identify bottlenecks and reduce drop-off rate.
Head to your quiz and click on the “Connect” tab.
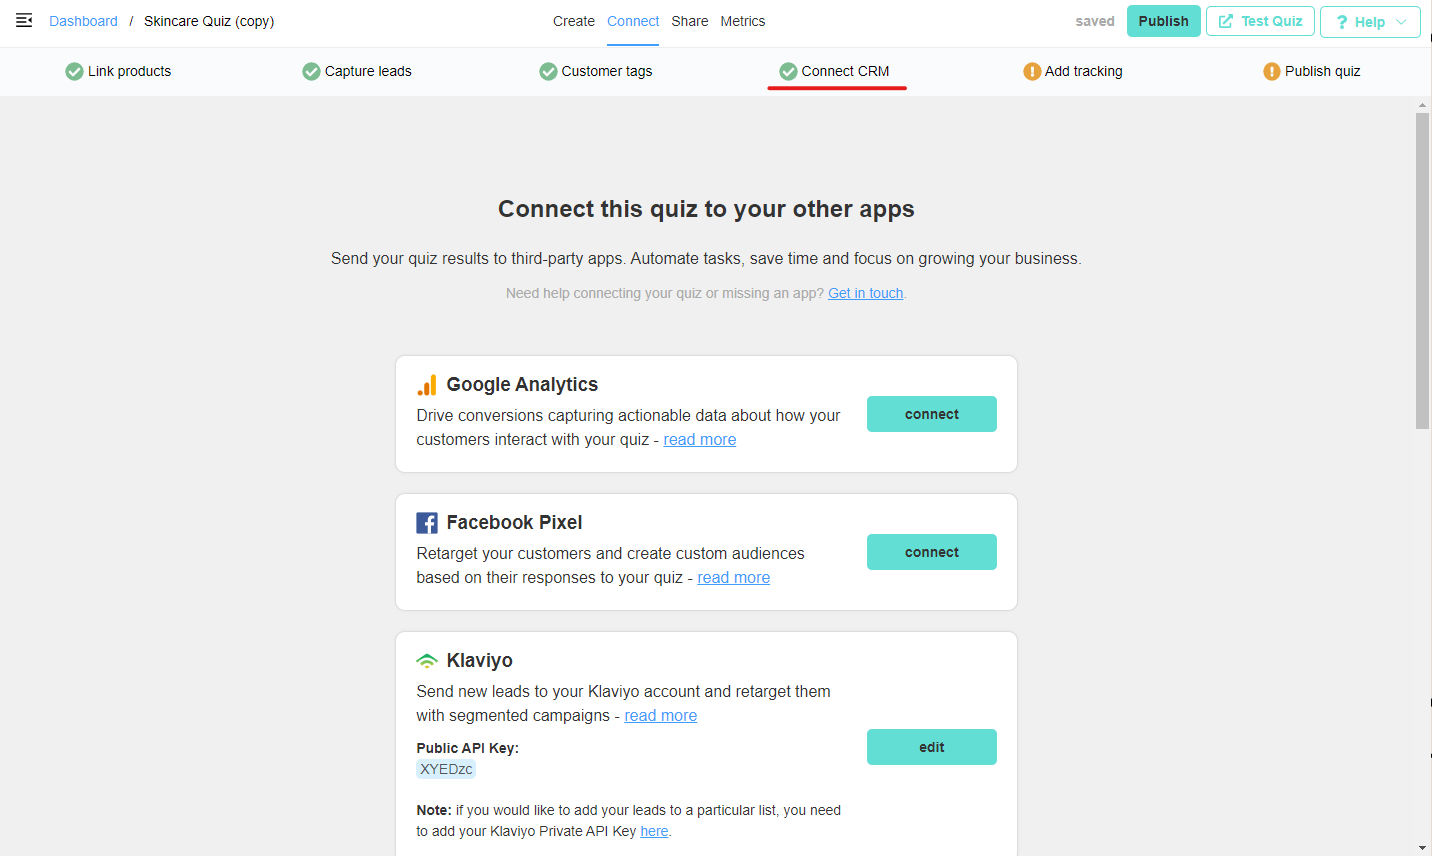
Click on the “connect” button in the Google Analytics section and paste your Google Analytics Tracking Code (G-xxxxx for GA4).
Don’t know how to find your GA tracking code? Check this link.
Where to find your GA4 tracking code?
Open your GA4 account and navigate to Settings > Data Streams.
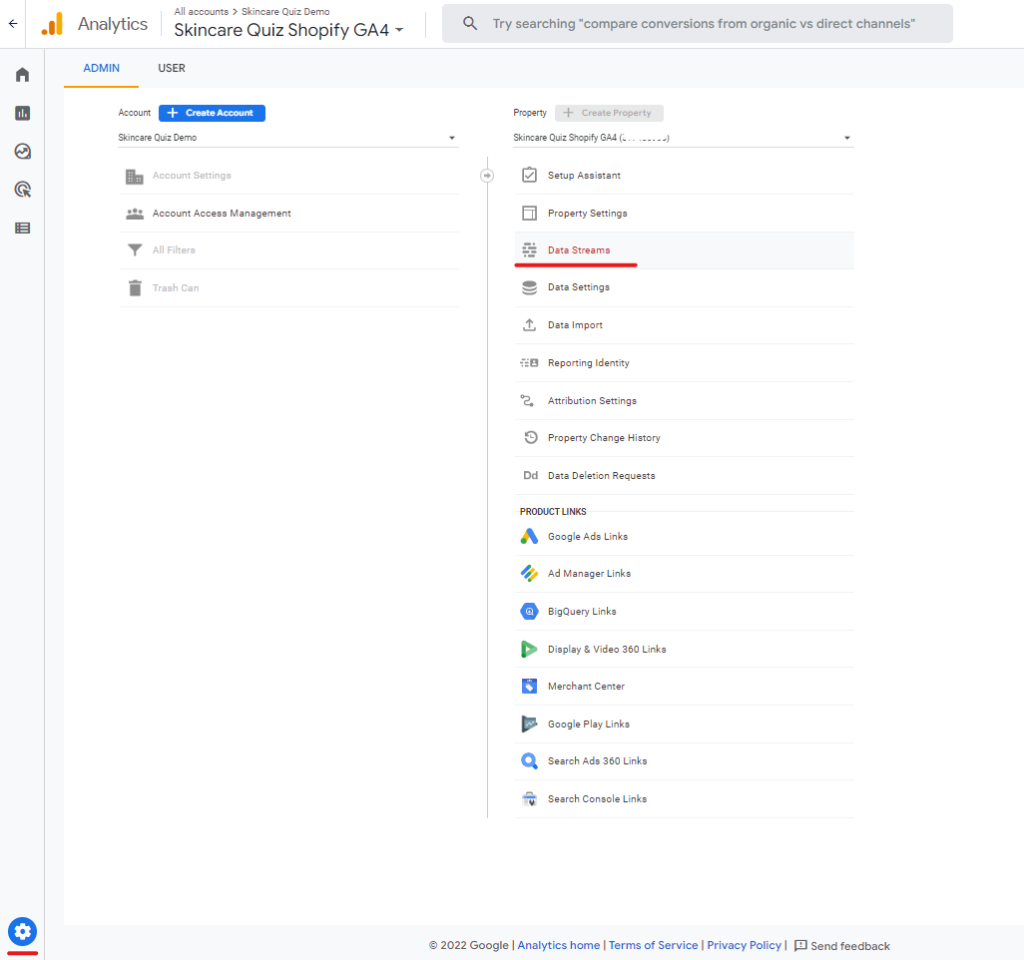
Select or set up a new data stream for your website.
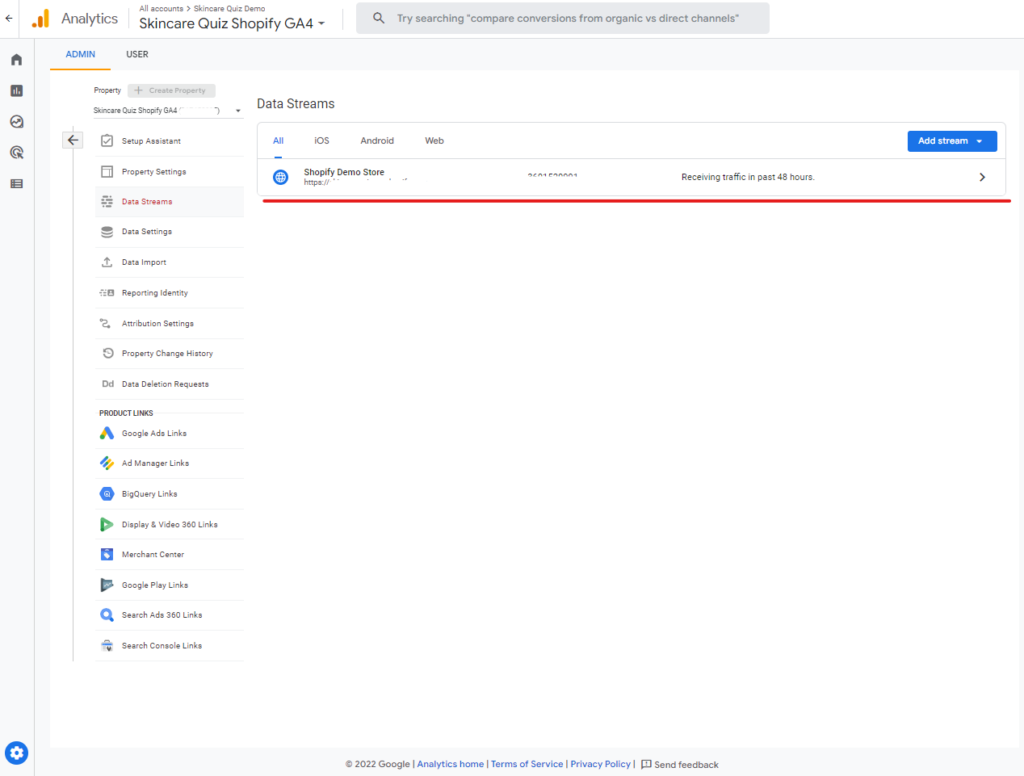
Open the stream and copy the Measurement ID.
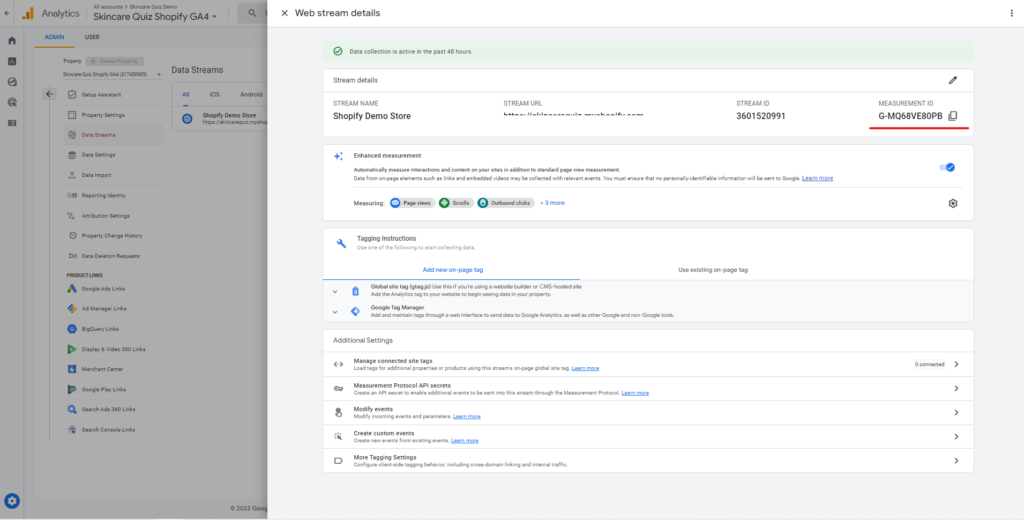
Copy the Masurment ID into the app’s Connect > Google Analytics section and publish the changes.
Track customer behavior (events)
You’ll be able to see quiz usage and customer behavior in your Google Analytics dashboard, under Reports > Engagement > Events.
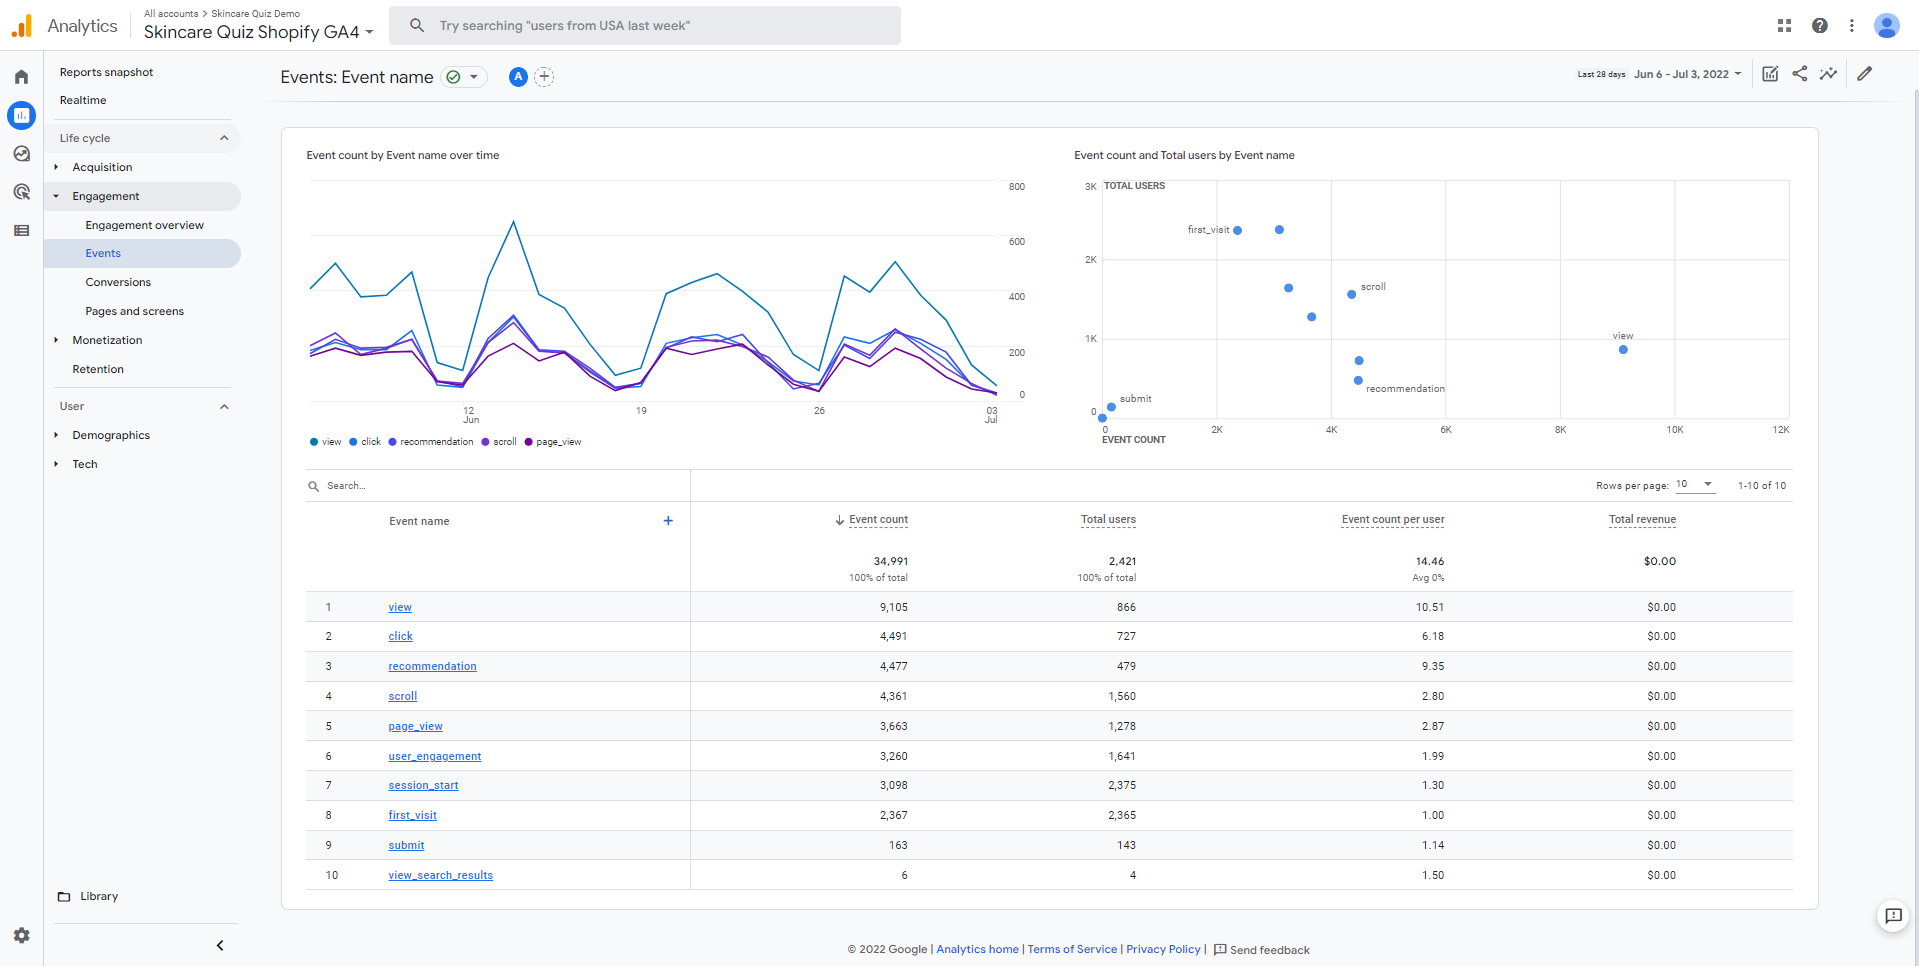
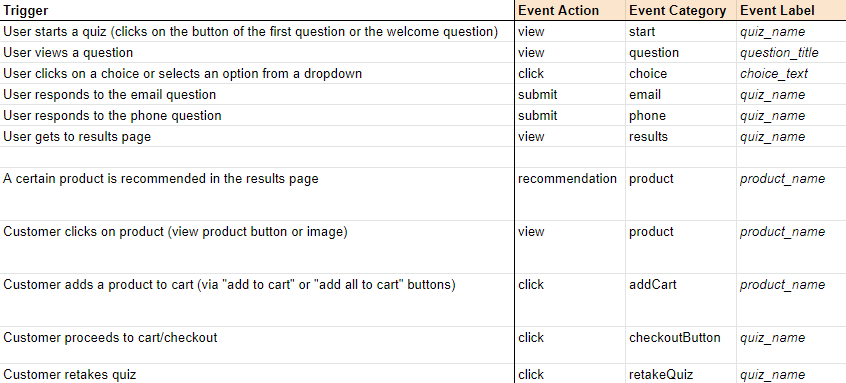
Events are triggered every time a customer starts a quiz, views a question, picks a choice, gets to the results page, adds a product to the cart, and proceeds to the cart/checkout. You can check more data about unique events by clicking on the specific Event name (previously Event Action in Universal).
Track quiz revenue
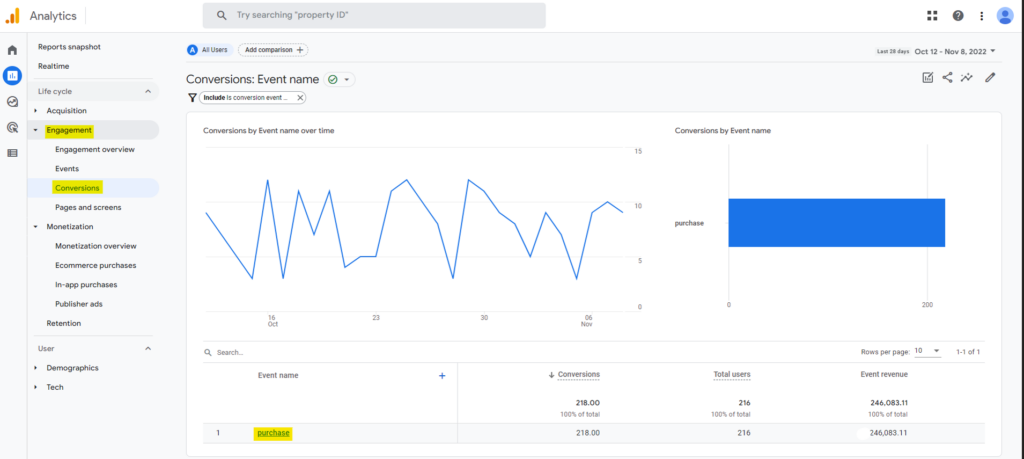
You’ll see revenue attributed to the quiz in Engagement > Conversions > Event name > purchase. Click on the “purchase” event.
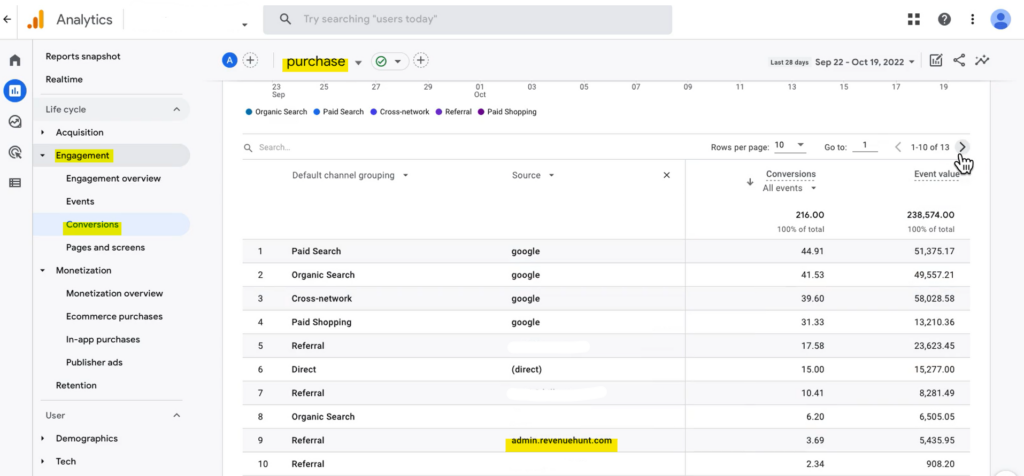
Add a “Source” column next to the default channel grouping and look for the rows which include the “revenuehunt” source.
(BETA) Add a Quiz Revenue exploration to your Google Analytics 4
You can build your own exploration of quiz revenue in your Google Analytics 4 account.
The exploration enables you to see how much revenue the quizzes have generated and attribute the original source/medium of the traffic.
Here’s how it looks:
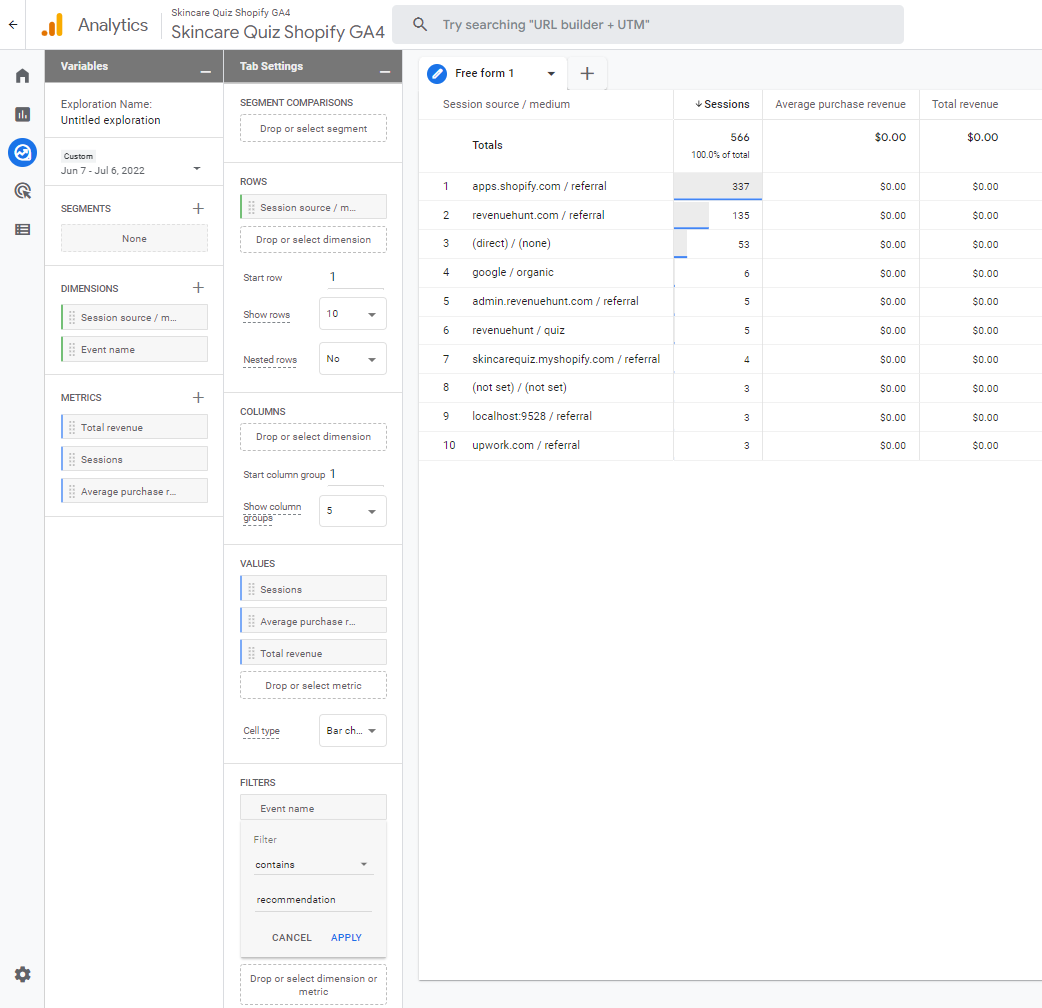
You can simply re-create the following report and add it to your GA4 account as a new exploration.
Guidelines:
- Remember to filter the data by the Event name “recommendation”, which allows you to see only the responses from the quiz.
- Session source/medium indicates the original source of the traffic.
- Sessions indicate the number of responses from the quiz (aka a number of sessions that reached the results page).
- Total Revenue indicates the revenue associated with the quiz.
WARNING: we’ve had reports that the explorations do not return the revenue data. Unfortunately, this is related to limitations on GA4 and there’s no fix as of yet.
How to exclude the quiz as source in Google Analytics
We strongly recommend not excluding your quiz as traffic source, but here’s how to do it if you need to.
Your quiz will set a new source/medium for the users who take it. This way, you’ll be able to monitor the sales that come through the quiz.
However, if you want to track their original traffic source (social media campaigns, paid ads, etc) you can do this by:
- exclude the admin.revenuehunt.com domain in Google Analytics. More info on how to exclude referral traffic here.
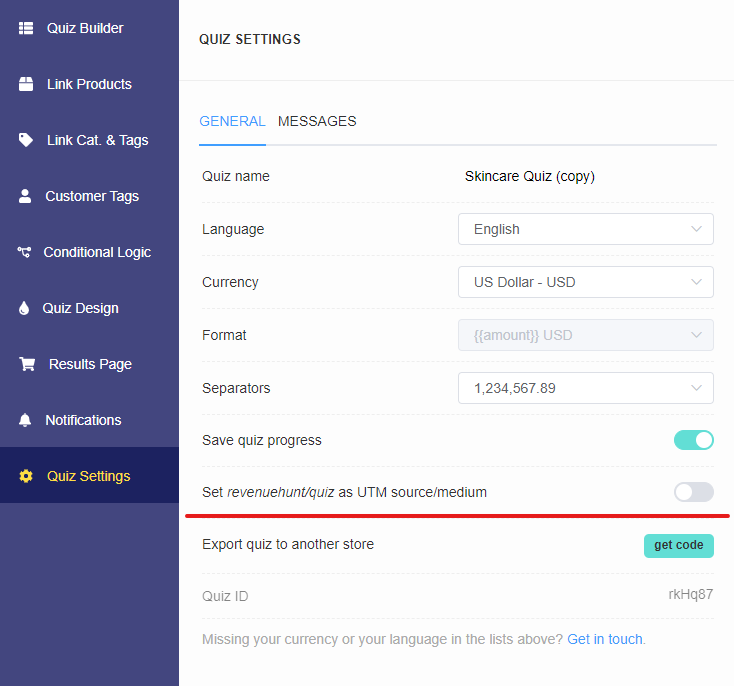
- Deactivate the “Set revenuehunt/quiz as UTM source/medium” toggle in the Quiz Settings:
Why returning users from excluded domains still appear in your reports?
Old traffic might appear as coming from the excluded domain.
This issue results from the default campaign timeout of 6 months:
- User A arrives to your site via a referral from Domain B before you add that domain to the Referral Exclusion List.
- That first session is attributed to Domain B.
- You add Domain B to the Referral Exclusion List.
- User A returns directly to the site (e.g., via a bookmark).
- Because of the last-non-direct-click attribution model, this second session is also attributed to Domain B.
Source: https://support.google.com/analytics/answer/2795830?hl=en#zippy=