Product quiz metrics: track what converts
The 4 quiz metrics that predict conversion, the benchmarks they should hit, and the platform data showing which numbers actually move revenue.
Four metrics predict whether a product recommendation quiz will move revenue or quietly underperform: completion rate, quiz-to-cart conversion, average order value, and recommendation precision. The platform data is unambiguous on the targets: top-converting quizzes hit 10.6% conversion when configured with a single results page, 71% of high performers make email capture required, and the 9-12 question sweet spot averages 11.0% completion-to-purchase. This guide walks through where to find each metric in the RevenueHunt dashboard, what target to aim for, and what to fix when the number lands below it.
What you'll learn
- 01Where each metric lives in the RevenueHunt Quiz Builder (Responses, Analytics, Drop Off panels).
- 02Platform benchmarks: 5.5% quiz-taker conversion (1 in 18), 10.6% at single results page, 11.0% at 9-12 questions, +11-15% AOV.
- 03The fix for each metric when it lands below target, organised by issue and solution.
- 04How to export raw response data for deeper analysis in Sheets or Excel.
For the foundations that produce these metrics, see how to build a successful product recommendation quiz. For the mistakes that quietly drag the numbers down, see product quiz mistakes ranked by industry data.
Table of contents:
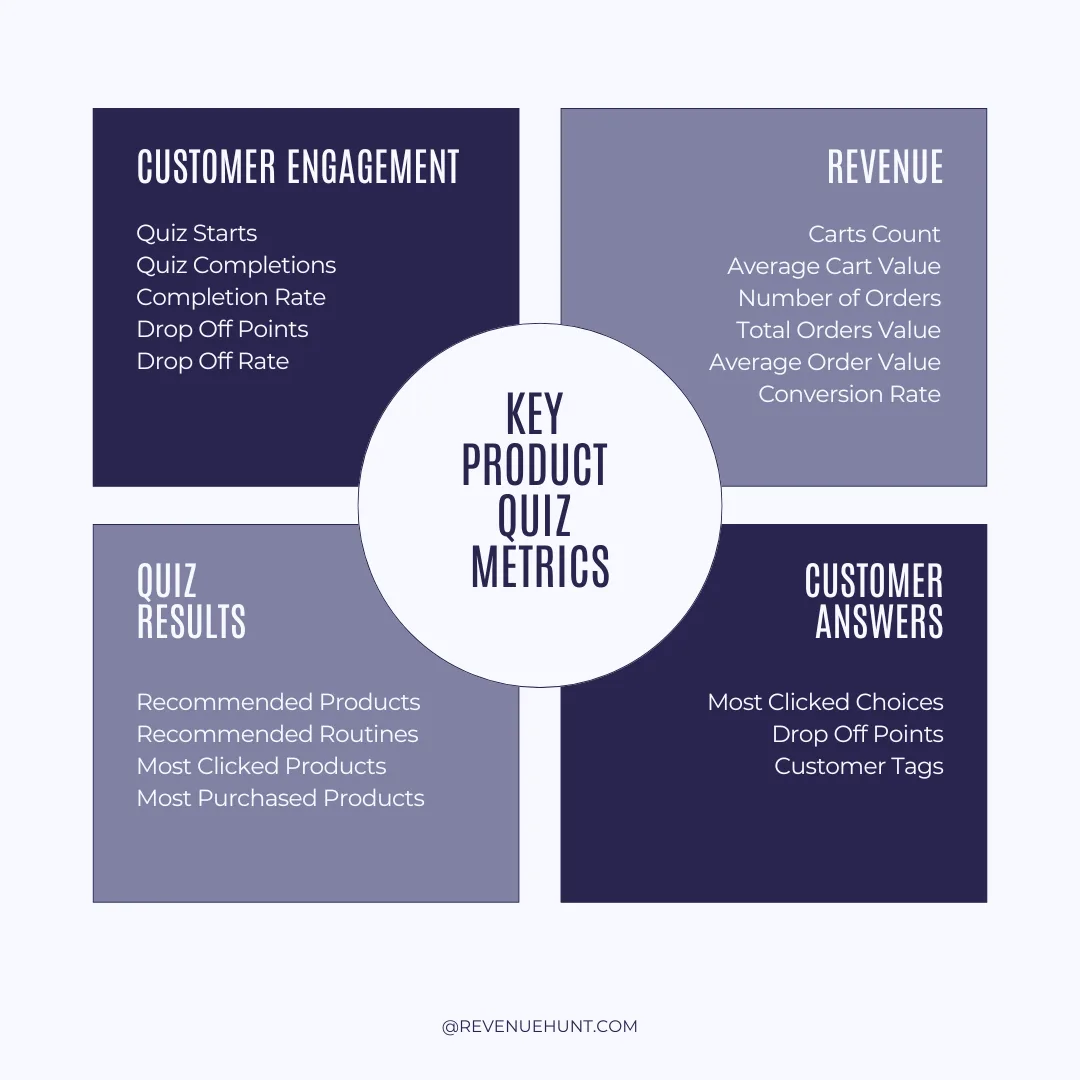
Fig. 01 The four metrics that predict whether a product recommendation quiz moves revenue or quietly underperforms: completion rate, quiz-to-cart conversion, average order value, and recommendation precision. Each diagnoses a different failure mode in the funnel.
Where to find the data
The Metrics panel has the same three sub-sections on every version of the RevenueHunt app (Responses, Analytics, Drop-off), but the location of the panel and the depth of order-level data differ between Built for Shopify and the legacy / multi-platform versions.
On Built for Shopify
Two ways to open the Metrics panel:
- Dashboard sidebar: click the Analytics tab.
- Per quiz: select the quiz, click the
...menu, then Analytics or Responses.
Order tracking and revenue attribution work natively because the app is connected to Shopify Customers under App Settings. The Analytics dashboard surfaces customisable default cards (Quiz Responses, Number of Orders, Total Orders Value, Drop-off Rate, Selected Choices), and the Responses panel has no 100-item cap. Data refreshes in real time for response events, on a roughly 5-minute cycle for cached aggregates, and once daily for order and revenue sync.
On Shopify Legacy
Open the Metrics panel from the Dashboard. The three sub-sections are the same as Built for Shopify (Responses, Analytics, Drop-off).
Revenue tracking is available, but it requires a one-time setup step: connect the app to Shopify Orders via the Connect tab. Once connected, the Analytics panel surfaces the same quiz-attributed order count and total order value that Built for Shopify shows by default; before connecting, Analytics shows engagement and cart-level data only.
On WooCommerce, Magento, BigCommerce and Standalone
Open the Metrics panel from the Dashboard with the same three sub-sections (Responses, Analytics, Drop-off). The structural difference: no native order or revenue integration on these platforms. Analytics shows Starts, Responses, Completion Rate, Carts Count and Cart Values, but no post-purchase order tracking surfaces inside the app. For cart-to-purchase attribution, cross-reference quiz responses (via CSV export) with your storefront platform’s order data, or use the Google Analytics integration for event-level tracking.
Note for Legacy and multi-platform versions: the Responses panel caps at the most recent 100 (Built for Shopify has no cap). For deeper historical analysis, export to CSV regularly. The export covers the last 90 days.
The three sub-sections in detail
-
Responses. Individual quiz submissions organised by date and timestamp. Click any response to see what choices the customer made, which products were upvoted or excluded, which products were recommended, and which customer tags were applied through to the results page.
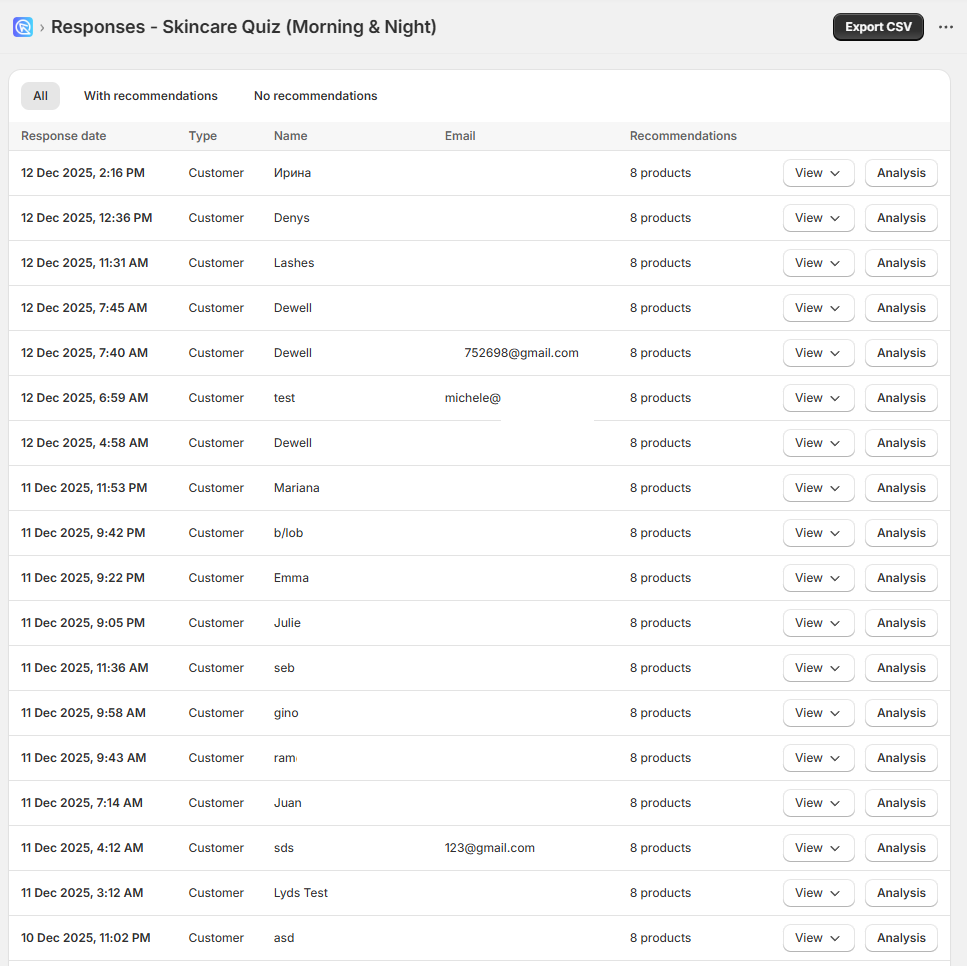
Fig. 02 The Responses panel on Built for Shopify: row-level quiz submissions with each customer's choices, recommendation and downstream actions. The raw signal feeds every other metric on this page; click any row to open the Analyze Response panel with the Quiz Copilot explanation.
-
Analytics. Graphs and KPIs covering quiz engagement, conversion rate, and (on Built for Shopify) revenue. Compare any date range against a previous period or another quiz on the same store.
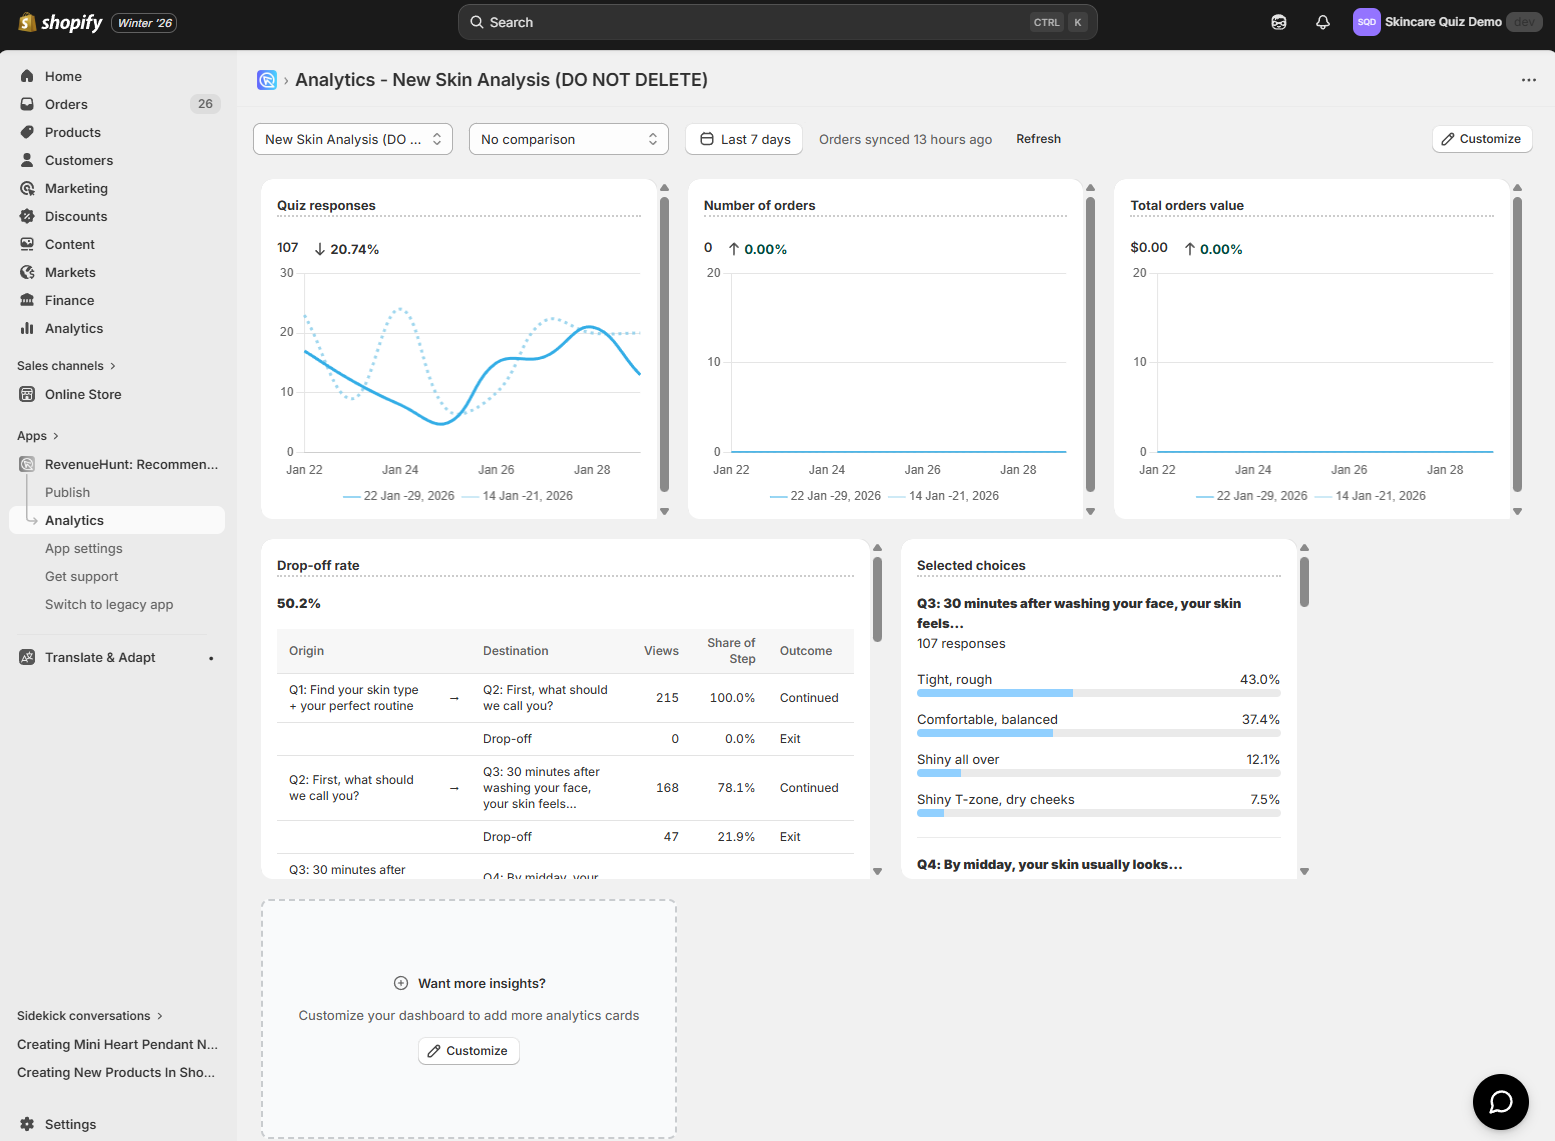
Fig. 03 The Built for Shopify Analytics dashboard. Customisable cards for Quiz Responses, Quiz Starts, Number of Orders, Total Orders Value, Average Order Value, Conversion Rate, Drop-off Rate and Recommended Items. The default surface most operators check daily; cards rearrange via the Customize button.
-
Drop-off. Percentage of users leaving the quiz at each question, shown as both a table and a funnel graph. The single most useful diagnostic when completion rate is below benchmark.
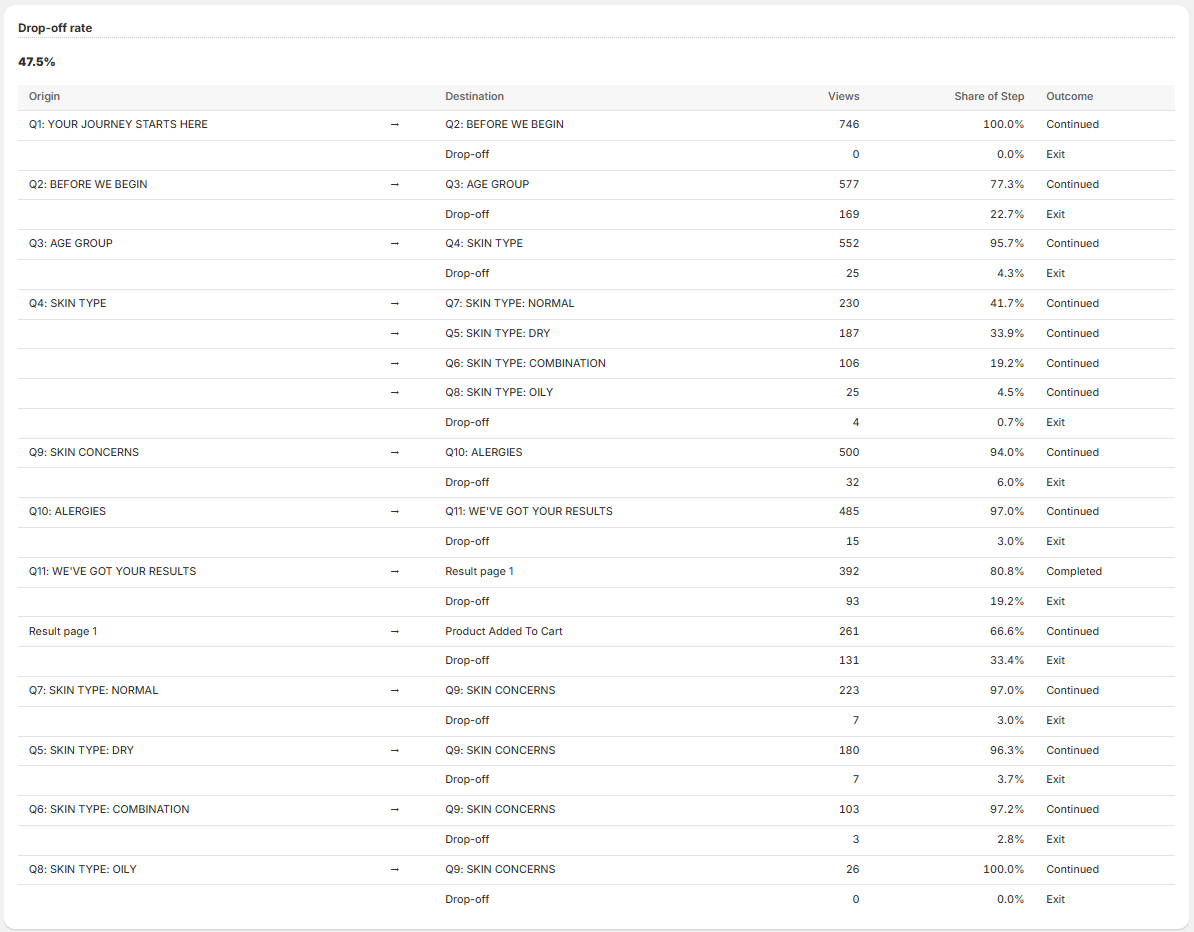
Fig. 04 The Drop-off table on Built for Shopify: per-funnel-step exit rate from intro through every question to the results page. The single most useful diagnostic when completion rate is below benchmark; a spike on a specific step is a precise instruction to rewrite or reorder it.
Download raw response data
If the in-app views don’t go deep enough, download all responses as a CSV file and analyse them in Google Sheets or Microsoft Excel. The export covers the last 90 days on the legacy and multi-platform versions and has no time cap on Built for Shopify.
Advanced tracking via Google Analytics and Facebook Pixel
For deeper attribution and choice-level event tracking, RevenueHunt integrates with Google Analytics 4 and Facebook Pixel. These integrations surface click rate per choice, traffic-source attribution, revenue per source, and per-step funnel data that the in-app Analytics panel doesn’t expose. On the legacy and multi-platform versions, the GA4 integration is the most reliable way to close the cart-to-purchase loop without leaving the analytics layer.
What to analyse and how to improve?
Customer Engagement
Quiz Starts and Completions
Tracking the number of quiz starts and responses/completions is fundamental. High start rates indicate good initial engagement, but the completion rate is what truly matters for conversions. If you notice a drop-off between starts and completions, it might be time to refine your quiz flow or simplify the questions.
Note: Quiz Starts refers to the number of people who have engaged with the quiz by passing the first slide. Quiz Responses refers to the number of people who have completed the quiz, aka. reached the quiz results page. If the customer closes the quiz before the results page, this will not be counted as a response/completion.
Completion Rate
Completion Rate is the percentage of quiz-starters who reach the results page. It’s the cleanest single signal of whether your quiz is engaging and user-friendly. Healthy ranges vary by category and quiz length, but as a rule of thumb: above 70% indicates a well-tuned quiz; below 50% means the quiz is too long, too text-heavy, or asking for personal data too early. Mid-quiz drop-off typically clusters around questions where the friction is structural: a mandatory phone-number field, a question the customer can’t answer with confidence, or a jarring design transition.
Platform data shows the 9-12 question sweet spot achieves 11.0% conversion on average; quizzes with only 1-5 questions actually underperform at 9.8% because the recommendation feels superficial and the customer doesn’t trust it.
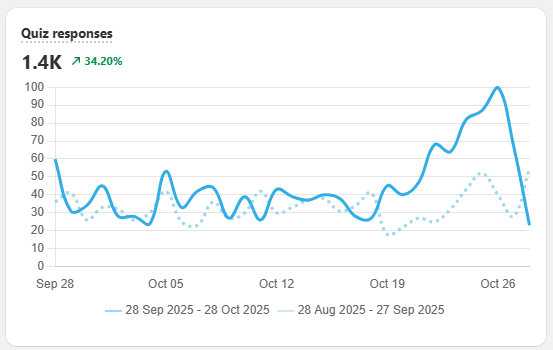
Fig. 05 The Quiz Responses card on the Built for Shopify Analytics dashboard, with a growth percentage vs the previous period. Pair this with the Drop-off table to see whether changes to the quiz flow are lifting completions or quietly leaking them.
Drop-off Points / Drop-off Rate
Identifying where users drop off in your quiz can provide insights into potential friction points. Are users abandoning the quiz at a specific question or step? Use this data to adjust those points, making them more intuitive or engaging.
Note: The drop-off rate is measured based on events, which are triggered whenever someone starts a quiz. Some of these start events can be blocked by adblocking plugins in browsers. If you see a difference between the number of quiz starts and the dropoff rate, that is because the number of quiz starts in the analytics tab is automatically adjusted by the algorithm to filter in also the starts blocked by the ad blocker plugin.
| Issue | Solution |
|---|---|
| Low Quiz Starts |
|
| Low Completion Rate/High Drop Off |
|
Revenue
Carts Count and Total Carts Value
Tracking how many users proceed to cart after completing the quiz can help you gauge the effectiveness of your product recommendations. A high cart count and total cart value indicate that the recommended products resonate well with the users.
Average Cart Value
Understanding the average value of products in the carts can help you assess the monetary impact of your quiz. This metric is crucial for evaluating the overall financial performance and can guide you in setting appropriate pricing strategies.
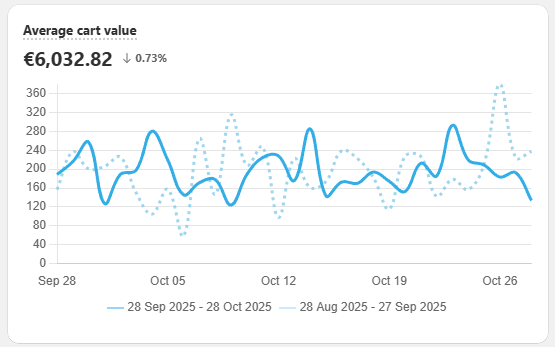
Fig. 06 The Average Cart Value card on Built for Shopify. Quiz-driven carts typically run 11-15% larger than non-quiz carts because the quiz recommends complete routines (cleanser + serum + moisturiser) rather than single SKUs. Pair with Number of Carts and Total Carts Value cards for the full revenue picture.
Number of Orders and Total Orders Value
For a more direct measure of conversion, track the number of orders placed and their total value. This data is especially powerful when integrated with Shopify Revenue Reports, allowing you to directly correlate quiz engagement with sales performance.
Average Order Value
Monitoring the average order value post-quiz completion provides insights into the spending behaviour of your users. Stores running quiz funnels typically see meaningful AOV lift versus collection-page browsing because the quiz can recommend a complete routine (cleanser + serum + moisturiser as three line items) rather than a single SKU. Single-product browsers buy one product; quiz-completers often buy a routine.
Conversion Rate
Conversion rate = (Number of purchases after quiz completion ÷ Total number of quiz completions) × 100To measure the conversion rate of your quiz, track the number of users who complete the quiz and proceed to make a purchase, then calculate the percentage of these users relative to the total number of quiz completions. This metric is essential because it reveals how effectively the quiz drives sales, aiding in optimising the quiz design and marketing strategies to maximise revenue.
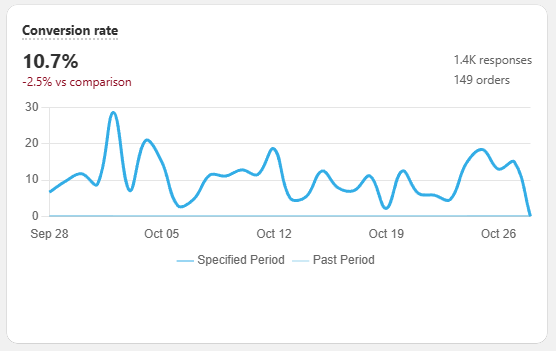
Fig. 07 The Conversion Rate card on Built for Shopify, computed natively from Shopify Orders. The single most actionable card on the dashboard once the quiz is live; this is the number every other metric on the page is ultimately diagnosing.
Platform benchmarks: 20,000+ stores, 45M+ responses, $370M+ merchant revenue (2026 report)
10.6%
average conversion at a single results page (79% of top performers use this configuration)
11.0%
conversion at the 9-12 question sweet spot
3-5x
lift over the 1.8-3% baseline ecommerce browse-and-buy conversion rate
These are the benchmarks to compare your own quiz against. If your conversion rate lands below 5%, the structural fixes in the table below recover most of the gap. If it lands above 8%, the rest of the leverage is in the follow-up email sequence and discount placement.
| Issue | Solution |
|---|---|
| Customers don't add products to cart |
|
| Low Conversion Rate |
|
| Customers add to the cart but don't buy |
|
| Customers purchase only once |
|
Tip: Not sure how to measure quiz revenue? Check our step-by-step guide here.
Recommendations
Recommendation Analysis
Delve into why specific products or routines were recommended most often. This helps in fine-tuning your recommendation algorithms. Analyzing individual responses allows you to understand customer preferences better and adjust your product catalogue accordingly.
Product and Slot Blocks
Evaluate the performance of product and slot blocks within the quiz. Ensure that the products being recommended are aligned with user preferences and catch their attention. This granular analysis can lead to better-targeted recommendations, improving user satisfaction and conversion rates.
Most Clicked Products
Track which products are most frequently clicked on during the quiz. This data reveals which products are generating the most interest and engagement. Use this insight to highlight popular products more prominently in your quiz and marketing efforts.
Most Purchased Products
Identify which recommended products are being purchased most often. This metric helps you understand the effectiveness of your recommendations in driving sales. Emphasize these high-performing products in future quizzes and promotional campaigns.
Least Purchased Products
Determine which products are being recommended but not purchased. Investigate potential reasons for low conversions, such as pricing, product appeal, or placement within the quiz. Adjust your strategy to either improve the attractiveness of these products or replace them with alternatives.
| Issue | Solution |
|---|---|
| Customers buy the same products all the time |
|
| Customers get empty recommendations |
|
Customer Answers
The quiz should help you answer the questions, such as who is my customer and what kind of products are they interested in, and what products they buy. You can understand these things by diving deeper into customer choices and open answers.
Most Clicked Choices
Measure which quiz choices are most frequently clicked. This data provides insights into customer interests and preferences. By understanding which options are most popular, you can improve quiz engagement by highlighting popular choices more prominently and ensuring that the flow of the quiz guides users towards these choices. To get data about most clicked choices you can use the two method highlighted below:
- Export as CSV
Regularly export quiz response data for in-depth analysis in Google Sheets or Microsoft Excel. This allows you to spot trends, understand user behaviour over time, and make data-driven decisions to enhance your quiz strategy. - Use Google Analytics
With GA4 you can measure extra information about the quiz and the customer. You can track customer behaviour with events like clicking a choice or a questions, answering an open question or clicking on a product or description. This provides more insight into who the customers are and how they interact with the quiz. By gathering information on the most clicked choices or elements, you can refine your quiz to better meet customer preferences, optimise the user experience, and increase engagement. These insights will enable you to continuously improve your marketing strategies, ensuring they remain relevant in attracting and retaining customers.
Customer Tags
Use customer tags collected from quiz responses to segment your audience effectively. Each quiz typically produces 5-10 zero-party data points per completion (skin type, concerns, goals, preferences, budget tier), which sync directly to Klaviyo as profile properties via the native integration. Segmented Klaviyo campaigns earn over 3x the revenue per recipient of generic sends (Klaviyo segmentation benchmark), and across the platform 1 in 5 quiz-attributed orders lands more than 30 days after the quiz (benchmark report). Both signals point to the segmentation layer is where most of the durable revenue lives. See how Klaviyo segmentation unlocks once zero-party data lands in profiles for the full activation chain.
| Issue | Solution |
|---|---|
| I don't know who my customers are |
|
| I don't know what my customers buy |
|
| I don't know how to make customers purchase regularly |
|
| I don't know which products are underperforming |
|
| I don't know how to keep my quiz content fresh |
|
Frequently asked questions
What completion rate should I aim for on my product recommendation quiz?
Above 70% indicates a well-tuned quiz; below 50% means the quiz is too long, too text-heavy, or asking for personal data too early. Healthy ranges vary by category and quiz length, but 70-90% is the band most well-built quizzes occupy. Anything claiming “90-100% completion” should be treated with scepticism: real quizzes have real drop-off, even excellent ones.
What conversion rate should I aim for after quiz completion?
The platform benchmark is 10.6% for top-converting quizzes with a single results page (which 79% of high performers use). Industry-average browse-and-buy conversion sits at 1.8-3%, so a well-built quiz funnel runs 3-5x the baseline. If your conversion is below 5%, the most common structural fixes are: collapse to a single results page, require email capture, connect to Klaviyo, and add a results-page discount.
How many questions should my quiz have?
6 to 12, with the 9-12 band typically performing best at 11.0% conversion. Shorter quizzes (1-5 questions) actually underperform at 9.8% because the customer doesn’t feel they’ve given enough signal for the recommendation to be personalised. The “keep it short” advice from older quiz guides was wrong; relevance matters more than brevity.
How do I track quiz revenue specifically?
The Analytics tab inside the RevenueHunt app surfaces Quiz Revenue alongside completion rate, start rate and drop-off-by-question. For Shopify stores, the Built for Shopify version reports quiz-attributed orders natively in the Analytics tab without any setup. For deeper analysis, export raw responses as CSV and cross-reference with Shopify order data, or use the Google Analytics integration for event-level tracking.
Which metric should I focus on first?
Conversion rate is the most actionable single number. Completion rate diagnoses friction in the quiz itself; AOV diagnoses recommendation quality; recommendation precision (which products convert from which answers) diagnoses your product-to-choice mapping. Start with conversion rate; if it’s below benchmark, the diagnostic order is: results page count first (collapse to one), then question count (6-12), then email capture (make it required), then Klaviyo integration (connect it).
Takeaways
By focusing on these four metrics, you can transform your product recommendation quiz into a measurable conversion engine. The platform benchmarks (5.5% quiz-taker conversion, 10.6% at single results page, 11.0% at 9-12 questions, +11-15% AOV uplift, 3-5x lift over baseline browsing) give you targets to compare against; the Issue/Solution tables above give you the structural fixes when a number lands below target. To estimate the lift on your own store, use our quiz ROI calculator.
For the foundation, see how to build a successful product recommendation quiz. For the mistakes that erode each metric, see product quiz mistakes ranked by industry data. For the email and discount layers that compound the wins, see the post-quiz follow-up sequence and product quiz discounts. For how repeat purchase rate, cohort retention, and NPS sit alongside these quiz metrics, see the measurement framework in our retention pillar. For the customer-tag layer that turns Recommendations and Customer Answers metrics into revenue, see customer tags in product quizzes. For concrete zero-party data mechanisms across real brands, see 12 zero-party data examples. For the consent moment that gates the whole stack, see marketing consent in a product quiz. For where these metrics sit inside the funnel narrative, see sales funnel stages: AIDA plus the post-purchase stage.
Install RevenueHunt: Recommender Quiz for Shopify and start tracking your first quiz response today. Free plan available.
Free tools & data
Put these benchmarks to work on your own store.
Free tool
Quiz ROI calculator
Estimate the extra revenue and ROI a product recommendation quiz could add to your store. Built on real data, no email required.
Calculate your ROIFree report
Ecommerce quiz benchmark report
How product recommendation quizzes really perform: conversion by category, AOV uplift, and completion, from 45M+ real quiz responses.
Read the report

Most shoppers leave because they can't find the right product