9.8% quiz CVR, $691K in 90 days: anti-ageing case study
How a US anti-ageing device brand hit 9.8% quiz-to-purchase conversion on cold Meta traffic and $691K in 90 days using a 12-step qualifying funnel quiz.
A 12-step qualifying quiz funnel replaced the beauty brand’s product page entirely. 9.8% quiz-to-purchase conversion on cold Meta traffic. $691,128 in 90 days. Full breakdown of the funnel architecture, the persuasion checkpoint strategy, and the AOV lift that changed the brand’s economics.
What you'll learn
- →Why the quiz replaces the product page entirely as the cold-traffic landing page on Meta.
- →The persuasion-checkpoint architecture: five validation screens inserted between the seven data-collection questions.
- →How the single-results-page rule produced 9.8% conversion on a $130 first-purchase price point from cold traffic.
- →What the 74,300 captured quiz responses gave the brand beyond conversion: demand intelligence, age-cohort segmentation, ad creative direction.
- →Six transferable lessons other brands can apply.
90-day disclosed results vs platform benchmark
9.8%
quiz-to-purchase CVR
Cold Meta traffic. The RevenueHunt platform benchmark is 5.5% pooled, 6.1% in beauty/skincare.
+42.64%
AOV lift
Average order value vs the prior quarter ($107.16 vs ~$75.13).
$691K
attributed revenue
90 days, 7,100 orders from 72,200 quiz completions, 75.2% completion rate.
01 · Executive summary
Not a conversion tool. A trust-building machine.
A US-based direct-to-consumer anti-ageing beauty device brand (specialising in at-home LED light therapy tools) needed a way to convert cold paid-social traffic into high-intent buyers of a premium-priced product. Instead of sending ad traffic to a collection page or a traditional product page, they deployed a multi-step qualifying quiz funnel as their primary ad landing page. The result: a sustained 9.8% quiz-to-purchase conversion rate, $691,128 in tracked quiz-attributed revenue across 90 days, and an average order value of $107.16 (42.64% higher than the prior quarter).
This case study examines how they built that funnel, why the structure worked, and what other brands in the beauty-device and skincare space can replicate from this approach. The strategic premise (quiz as the landing page, not a popup on top of a product page) is the same argument the polished pillar piece quiz funnels vs collection pages makes in the abstract. This article is the worked example.
Case at a glance
| Vertical | At-home anti-ageing skincare devices |
| Platform | Shopify |
| Traffic source | Meta paid social (cold) |
| Price point | $130 USD (device + optional serum bundle) |
| Target demographic | Women 55+; 85.1% of respondents 65+ |
| Reporting window | 90 days (January-April 2026) |
| Quiz-to-purchase CVR | 9.8% on cold Meta traffic |
| AOV lift | +42.64% ($75.13 → $107.16) |
| Attributed revenue | $691,128 |
| Quiz completion rate | 75.2% across a 12-step funnel (72,200 of 96,100 starts) |
| Data source | Built for Shopify RevenueHunt Analytics dashboard, Shopify Orders ledger (first-party) |
| Vs platform benchmark | 9.8% CVR vs 5.5% pooled, 6.1% beauty/skincare (state of product recommendation quizzes) |
02 · The brand
Premium anti-ageing devices
The brand operates in the premium at-home beauty device vertical: a fast-growing category driven by consumers seeking professional-grade results without the cost, inconvenience, or risk of in-clinic treatments. Their flagship product is a multi-function facial sculpting device priced at approximately $130 USD. The brand pairs the device with a complementary serum, frequently sold as a bundle.
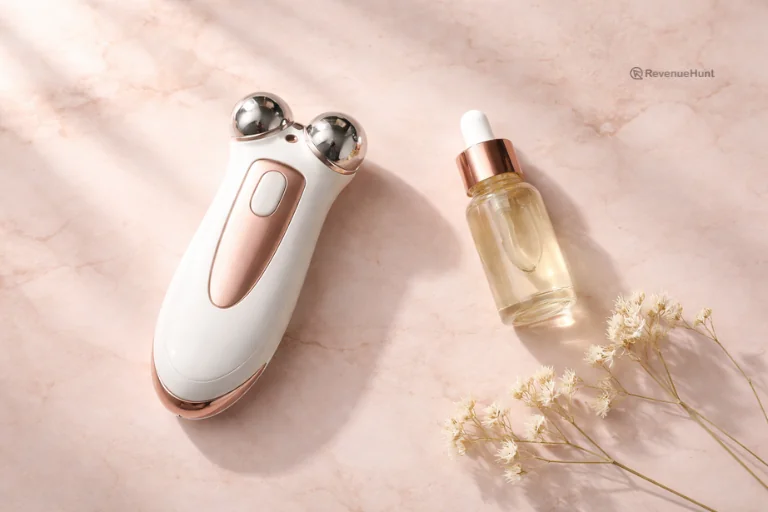
Fig. 01 The brand's flagship product, an at-home facial sculpting device paired with a hydrating serum (illustrative, not the actual product).
Their customer base is explicitly concentrated in the 55+ demographic. This is a high-intent, purchase-ready segment that is highly motivated by anti-ageing outcomes (wrinkle reduction, skin firmness) but is also sceptical of topical products that have not delivered visible results. The brand’s core proposition (a non-invasive, at-home alternative to Botox and fillers) speaks directly to that scepticism.
The brand runs on Shopify, drives the majority of its customer acquisition through Meta (Facebook and Instagram) paid ads, and uses the quiz as the primary landing page for its ad traffic. With 100,000+ customers served and a strong review base, they are a scaled, review-validated operator in a competitive space, not an early-stage experiment. Their challenge was not proving product-market fit. It was converting cold traffic efficiently at a price point ($130+) that requires trust-building before checkout.
03 · The challenge
Converting sceptical buyers at a premium price point
Driving cold paid-social traffic directly to a product page for a $130 device faces a structural conversion problem. The target customer is a woman in her 60s or 70s who has tried daily moisturisers, anti-ageing creams, hyaluronic acid, retinol and even clinical treatments like microneedling or Botox. She arrives with a history of disappointment. She has spent money before. She has seen promises before. A static product page cannot acknowledge that history, address her specific concerns, or earn the trust required to justify a $130 purchase from a brand she’s encountering for the first time.
The three core conversion barriers this brand faced were:
- Scepticism from prior product failure. A majority of prospects had tried multiple topical anti-ageing solutions without satisfactory results. A product page headline alone cannot overcome this objection in the 15-30 seconds before a bounce.
- Concern specificity. Quiz data reveals that prospects have distinct, named concerns: wrinkles, fine lines, loose skin, dark spots, distributed across specific facial zones. A generic product page cannot address this granularity.
- Price-point friction. At $130, the product requires perceived personalisation and validation before a first-time buyer commits. The standard DTC approach (discount popup, product page, add to cart) creates insufficient trust velocity for this demographic at this price. For the broader argument on why entry-popup-based capture fails this kind of audience specifically, see why popups are walls and quizzes are doors.
The brand needed a conversion mechanism that could do three things simultaneously: qualify the prospect by surfacing their specific concerns, build trust by demonstrating the product was designed for someone exactly like them, and overcome the objection that “nothing has worked before.” A static landing page cannot do all three. A quiz funnel can.
04 · The strategic decision
The quiz as the ad landing page
Rather than treating the quiz as a supplementary on-site tool (a popup, a navigation item, a “find your routine” experience), this brand made a structural decision: the quiz is the ad landing page. All paid traffic from Meta campaigns routes directly to the quiz URL, not to the homepage or a product page. This means the quiz is not a nice-to-have conversion enhancement; it is the first touchpoint a paid visitor encounters with the brand.
This decision was rooted in a clear hypothesis: the 55+ consumer arriving from a Meta ad has a 15-second window before she decides whether to stay or bounce. A product page uses that window to describe features. A quiz uses that window to ask about her. The brand bet that a well-structured qualifying experience (beginning with age, moving to specific concerns, then to treatment history, then to desired outcomes) would build enough perceived personalisation to sustain engagement through to a purchase-ready results page.
The RevenueHunt: Recommender Quiz app was selected as the platform because it supported the full architecture this approach required: conditional logic branching (so the quiz could route different age groups and concern profiles through customised paths), persuasion checkpoints between data-collection questions (informational screens that build the case for the product mid-flow), a single focused results page with a direct purchase CTA, and the visual customisation needed to match the brand’s blush-pink aesthetic without breaking the immersive experience. The no-code builder allowed the marketing team to build and iterate the quiz logic independently, without developer dependency.
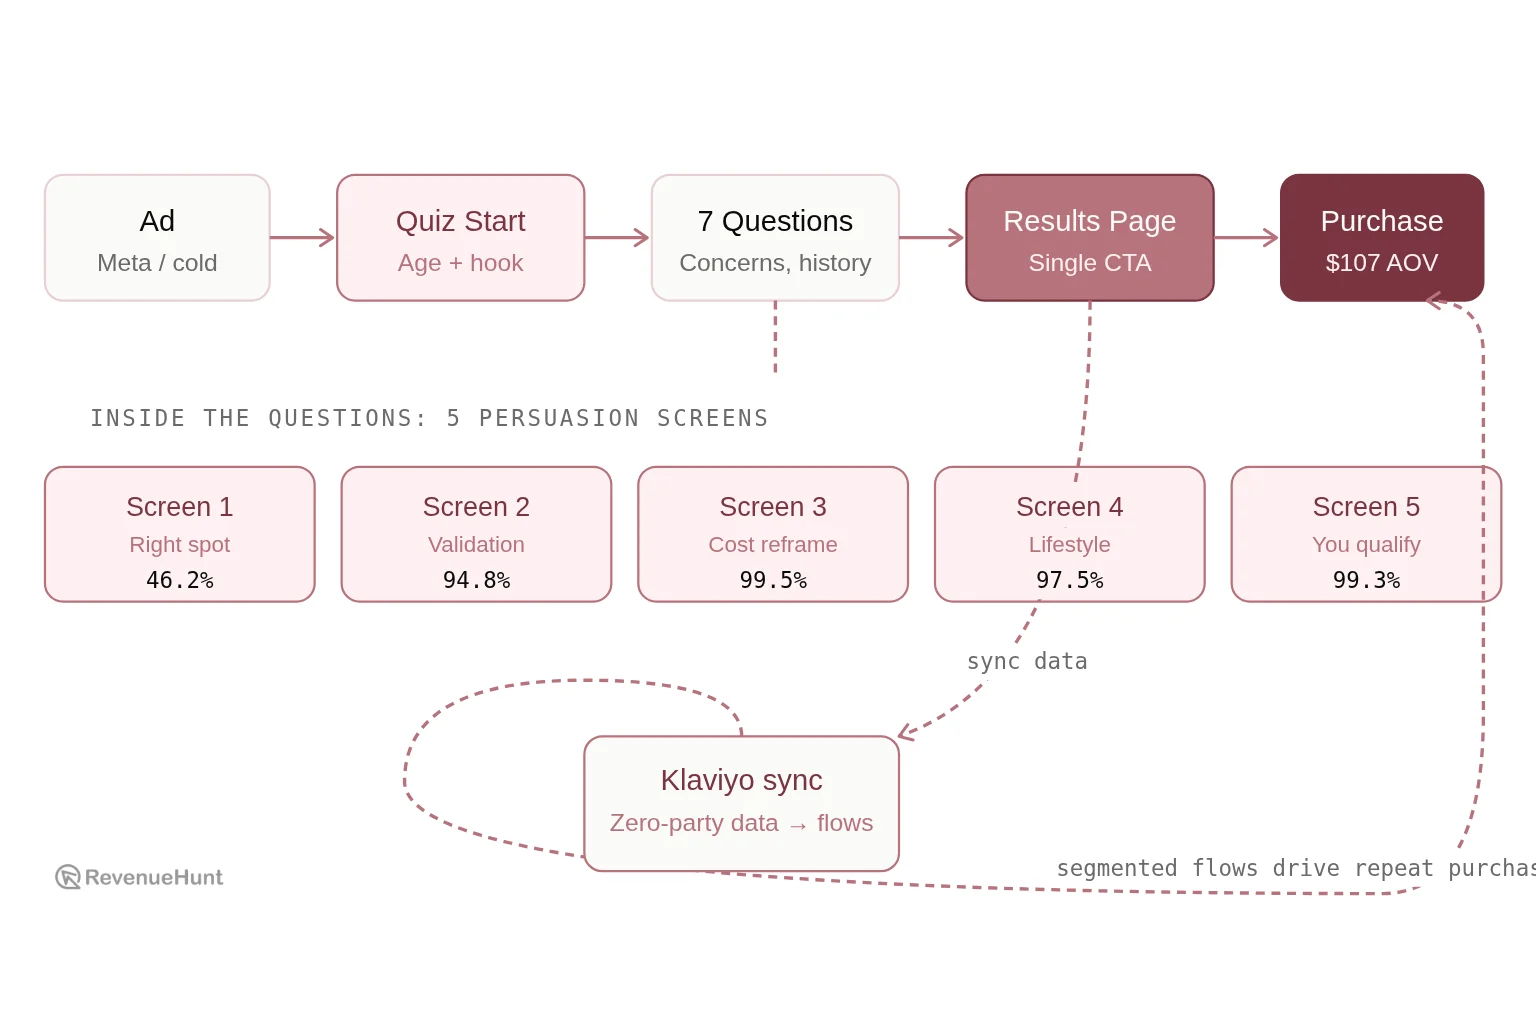
Fig. 02 How the qualifying quiz funnel works. Cold ad traffic enters a 12-step experience that alternates between data-collection questions and persuasion checkpoints before routing every completer to a single purchase-ready results page. Quiz answers sync automatically to Klaviyo for post-purchase segmentation.
05 · The implementation
A 12-step qualifying funnel with embedded persuasion
The quiz is hosted at a dedicated page URL and runs as the full-screen brand experience. It opens with a value-anchored hook (offering a significant discount incentive to begin) and then moves through a carefully sequenced flow that alternates between data-collection questions and embedded persuasion screens. The quiz uses a single results page delivering one focused recommendation rather than branching outcomes.
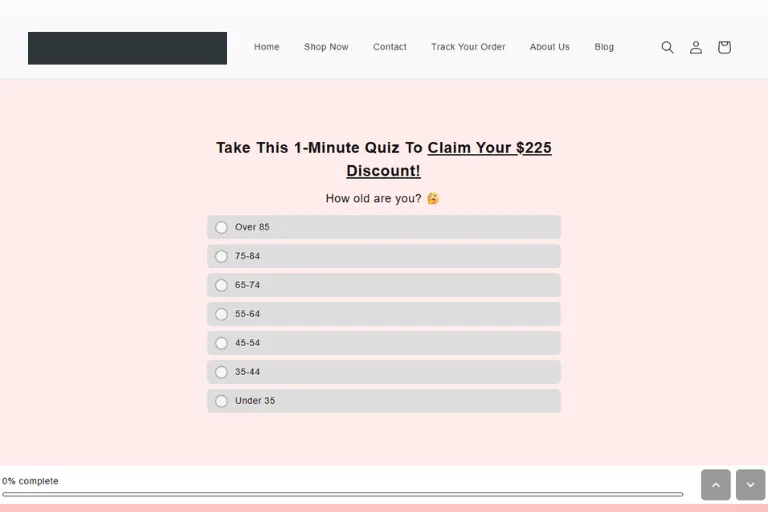
Fig. 03 The quiz opens immediately with a value hook and the first qualifying question, age.
5.1 Quiz structure overview
| Element | Detail |
|---|---|
| Total steps | 12 (questions + persuasion screens), with multiple branching paths |
| Data-collection questions | 7 |
| Persuasion screens | 5 validation checkpoints embedded between questions |
| Logic type | Conditional branching based on concern profile |
| Multiple-selection questions | 3: concern location, prior products, desired outcomes |
| Results pages | 1; 100% of completers route to a single results page |
| Results page CTA | Single product recommendation with personalised concern summary plus limited discount |
| Visual design | Default template, brand-matched blush-pink colour scheme, progress bar visible throughout (no custom CSS or JavaScript) |
5.2 The persuasion architecture
The most distinctive element of this implementation is not the data-collection logic. It is the embedded persuasion checkpoints inserted between standard questions. Rather than running straight through 12 questions to a results page, the quiz deploys five informational screens that use the user’s own prior answers to validate their concerns and build the case for the product. These screens are not questions. They are trust-building moments.
| Screen | Continuation |
|---|---|
| Screen 1, “You’re in the right spot.” Appears after the concern question and shows a before/after user transformation image with social proof. | 46.2% |
| Screen 2, “Don’t worry if other solutions haven’t worked…” Appears after the prior-products-tried question. Validates topical product failure and positions the device as categorically different. | 94.8% |
| Screen 3, cost-reframe. Appears after prior treatment history. Validates that clinical treatments (Botox, fillers) are expensive, then pivots to the at-home alternative. | 99.5% |
| Screen 4, schedule and lifestyle reframe. Addresses the “I don’t have time” objection by emphasising a 5-minute daily routine. | 97.5% |
| Screen 5, “Congratulations, you qualify!” Confirms personalised fit with a social-proof photo grid of real users. The final gate before the results page. | 99.3% |
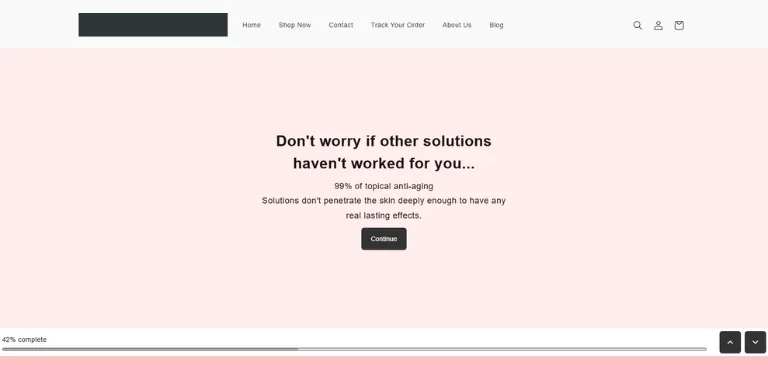
Fig. 04 "Don't worry if other solutions haven't worked..." is the highest-impact persuasion checkpoint, addressing the prior-product-failure objection in the same breath the user surfaces it.
5.3 Drop-off performance
The quiz achieves a 75.2% overall completion rate (72,200 completions from 96,100 starts), with a total drop-off rate of 24.8%. The majority of drop-off occurs at the very first question. Once a user completes Q1, the branching flow retains nearly everyone through to the results page.
06 · The results
90-day performance data
6.1 Headline metrics
| Metric | Jan-Apr 2026 | Oct-Jan 2026 | Change |
|---|---|---|---|
| Average order value | $107.16 | ~$75.13 | +42.64% |
| Average cart value | $109.54 | ~$95.87 | +14.26% |
| Conversion rate (quiz to purchase) | 9.8% | ~10.1% | -0.3% (stable) |
| Total orders | 7,100 | ~19,400 | -63.5% (seasonal) |
| Total revenue | $691,128 | ~$1.45M | -52.4% (seasonal) |
| Quiz starts | 96,100 | ~228,800 | -58.0% (seasonal) |
| Quiz completions | 72,200 | ~191,000 | -62.3% (seasonal) |
| Quiz completion rate | 75.2% | 82% | seasonal |
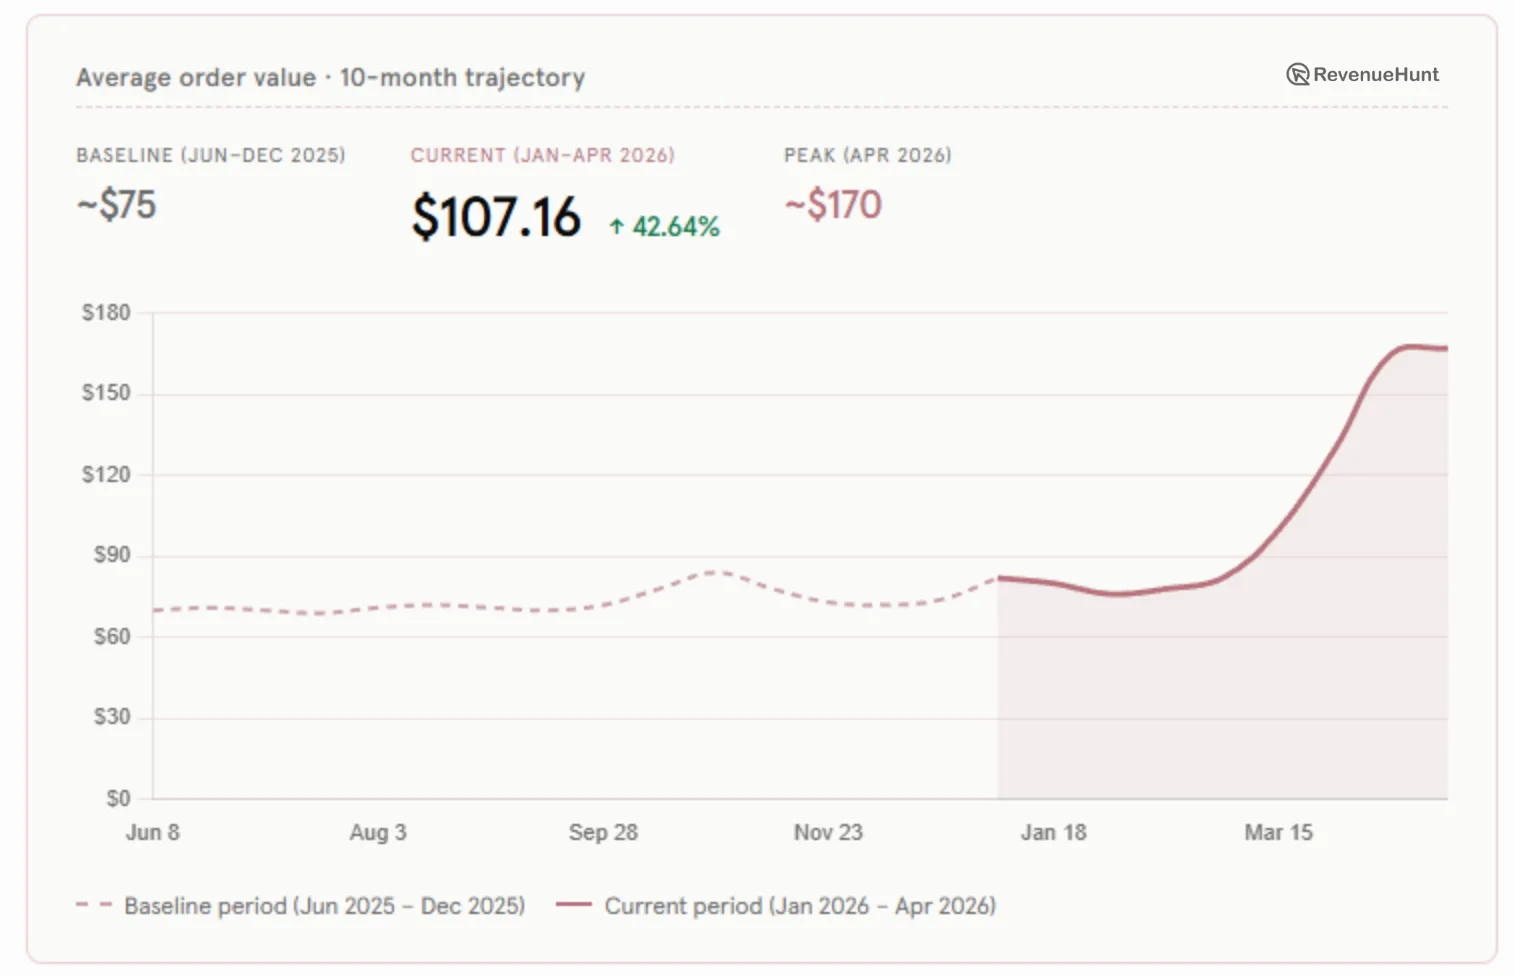
Fig. 05 AOV jumped from a flat ~$75 baseline to $107 current, peaking near $170 by mid-April, a 42.64% lift.
Note on volume comparison: the prior 90-day period (Oct-Jan) includes Black Friday, Cyber Monday, and the holiday shopping season, a structurally higher-traffic, higher-order period for all DTC brands. Volume declines in the Jan-Apr period are consistent with normal seasonal patterns. The AOV lift of 42.64% is therefore the more meaningful year-on-year signal: the quiz is extracting significantly higher per-transaction revenue during the lower-volume post-holiday period, suggesting improved funnel targeting or reduced promotional discounting depth.
6.2 Conversion funnel performance
The quiz achieves a 9.8% conversion rate from quiz responses to completed orders, meaning that for every 10 people who complete the quiz, approximately one makes a purchase. Given that the quiz is the first touchpoint for cold paid-social traffic (not a retargeting audience or warm email list), this is a strong performance indicator for a $130 product, well above the 5.5% pooled benchmark and the 6.1% beauty/skincare median reported in the state of product recommendation quizzes.
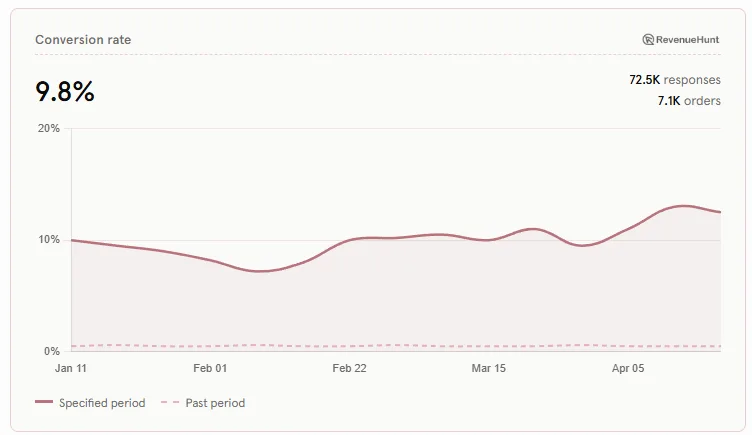
Fig. 06 Conversion rate averaged 9.8% across 72.5K responses, trending upward into April.
At 96,100 quiz starts and 72,200 completions, the funnel retains 75.2% of traffic through the full experience, a high completion rate attributable primarily to the strong hook (value-anchored opening question) and the high mid-funnel continuation rates driven by the persuasion checkpoints (all mid-funnel steps at 94-99.9% continuation). The single-results-page architecture eliminates post-quiz decision fatigue: every completer sees one focused recommendation.
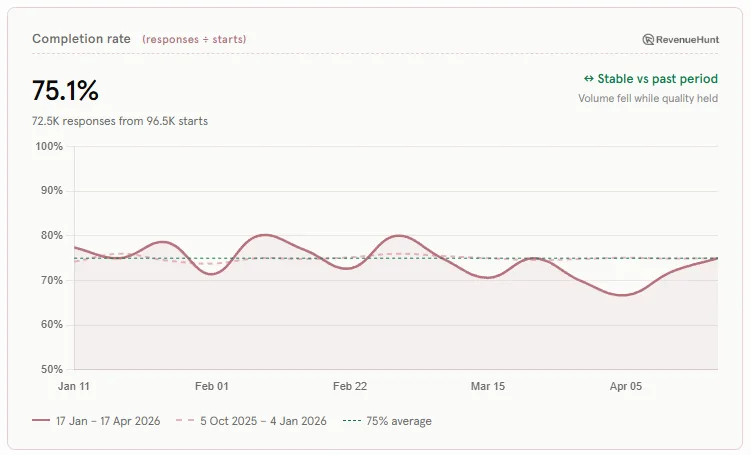
Fig. 07 Completion rate held at ~75% across both periods, tracking stability even as volume fell.
6.3 Demand intelligence from quiz data
Beyond conversion, the quiz has generated a rich demand-signal dataset across 74,300+ complete responses. Each response is zero-party data: self-declared, consented, attached to the customer record. (Together with order history and email engagement, the responses populate the brand’s first-party data layer, which is the structural moat now that third-party cookies and pixel signal are degrading.) Key audience insights captured:
-
Age concentration. Validates the brand’s targeting precision and allows Klaviyo segmentation by age cohort for follow-up messaging. (Klaviyo segments built from quiz answers earn meaningfully more per recipient than non-segmented flows.)
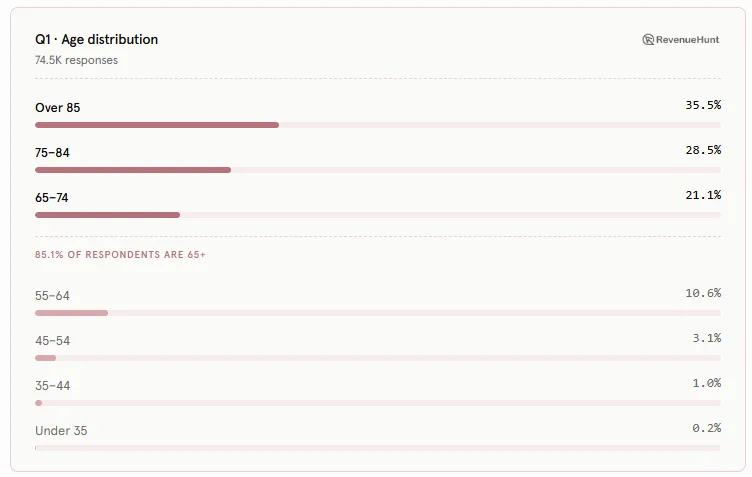
Fig. 08 85.1% of the 74,500 respondents are 65 or older.
-
Primary concern dominance. Creates a multi-concern audience that can be segmented for targeted email flows.
-
Treatment history as purchase-intent signal. Indicates a significant clinical-treatment-aware segment that is likely to respond to cost-comparison and at-home convenience messaging.
-
Desired outcomes mapping. Directly informs creative copy for retargeting and email flows. Quiz answers also become structured event properties when the Meta Pixel integration is enabled, feeding the brand’s paid-acquisition stack with first-party concern signal.
07 · What made it work
The four structural decisions that drove performance
7.1 The quiz as the first touchpoint, not a secondary tool
The single largest differentiator in this implementation is the strategic decision to make the quiz the primary ad landing page. Most brands deploy quiz tools as on-site widgets or popups: tools that serve visitors who already arrived and stayed. This brand sent cold traffic directly into the quiz experience before the visitor had seen the brand at all. That decision amplifies every downstream engagement metric, because the quiz’s qualification logic begins filtering for intent before a single product feature has been communicated.
7.2 Persuasion checkpoints replace the standard “results page only” model
The conventional quiz architecture builds to a single results page that carries the full persuasion load. This brand distributed the persuasion work across five intermediate screens, each addressing a specific objection at the moment in the flow when the user’s own answers had just surfaced the relevant concern. The screen confirming “other solutions haven’t worked” appears immediately after the user has listed the products they’ve tried. The cost-reframe screen appears immediately after they’ve confirmed clinical treatment history. This is contextual persuasion: the objection is raised and addressed in the same breath, which is significantly more effective than a results page that must address every objection simultaneously.
7.3 Single results page eliminates post-quiz decision fatigue
100% of completers route to a single results page with a single product recommendation. No branching outcomes. No “you might like these 4 products.” The quiz asks 7 questions about specific concerns and then delivers one answer: a device confirmed as safe, gentle, and effective for the user’s exact concern profile. This aligns with the RevenueHunt platform benchmark finding that the highest-converting quiz implementations use a focused single-results-page structure. For a brand with a focused product line, this architecture removes all residual decision friction at the point of highest intent.
7.4 Age-first qualification aligns traffic with product-market fit
Opening with an age question does double duty: it captures a critical segmentation data point AND it immediately signals to the user that this experience is designed for someone in their demographic. For the 65+ target customer, seeing age ranges of 55-85+ as the first question confirms this quiz was built for her, not for a generic skincare audience. A low drop-off rate at Q1 validates that this opener creates commitment, not hesitation.
For any product requiring trust before purchase, the quiz is not a conversion optimisation tactic. It is the conversion strategy.
08 · Lessons learned
What other brands can apply
- Use the quiz as the ad landing page, not a supplement to it. Routing paid traffic directly into a qualifying quiz means every ad click enters a conversion experience designed to build trust before revealing price. This brand generated $691,128 in 90 days with the quiz as the sole entry point for cold traffic.
- Embed objection handling mid-quiz, not just on the results page. The five persuasion checkpoints each appear immediately after the question that surfaces the relevant objection. This achieves 94-99.9% continuation rates at mid-funnel steps because resistance is addressed in real time, not deferred to the end.
- Ask about prior product and treatment history, then use it. Questions about prior products tried are setup questions for the persuasion screens that follow. The “other solutions haven’t worked” screen lands harder because the user has just admitted which solutions she tried. Map what your users have already tried, then validate their frustration.
- Lead with the result, not the product. The results page opens with a personalised summary of the user’s concerns before presenting the recommendation. Confirming fit before asking for the sale is the structural reason a 9.8% conversion rate is achievable for a $130 product from cold traffic.
- Age-segmentation data compounds over time. With 74,300 complete quiz responses and a verified age concentration, this brand now holds a demand-intelligence dataset that fuels Klaviyo segmentation, ad creative targeting, and product development; value that extends well beyond the initial conversion metric.
- A 75% completion rate is achievable on a 12-step quiz. The conventional wisdom that longer quizzes lose users does not hold when the content is immediately relevant to the respondent.
FAQ
How is this different from the typical “find your product” quiz? Most on-site quizzes are widgets that fire after a visitor has already engaged with the homepage or a product page; they exist to nudge the already-curious. This brand inverts the model. The quiz is the ad landing page: cold paid-social traffic lands on Q1 before encountering any other brand surface, and every paid click enters a qualifying flow rather than a product shelf. The persuasion checkpoints, single-results-page architecture, and age-first qualification all follow from that decision.
Can this approach work on lower price points (under $130)? The 9.8% quiz-to-purchase rate and +42.64% AOV lift here are particularly well-suited to a considered-purchase price point where trust gating produces outsized lift. At lower price points the trust gap is smaller, so the conversion-rate delta from a 12-step funnel is usually narrower. The structural lessons (quiz as landing page, mid-flow persuasion, single results page) still transfer; the optimal length and persuasion-checkpoint count typically does not. For sub-$50 categories a tighter 5-7 step variant tends to outperform.
What is a “persuasion checkpoint” operationally? A non-question screen inserted between data-collection questions that uses the user’s just-given answer to validate a concern, reframe an objection, or introduce social proof. It costs the user no cognitive effort (no input required), but advances the buying argument while their stated context is still loaded. Continuation rates on this brand’s five checkpoints ranged from 94.8% to 99.5%, which is why the funnel sustains 75% completion across 12 steps.
How was the 42.64% AOV lift actually achieved? The lift comes from two effects compounding: (1) the results page bundles the device with a complementary serum as the default recommendation, lifting basket size on every order, and (2) the quiz qualifies traffic for intent before price is revealed, so buyers reaching the results page are pre-validated and less price-sensitive than cold product-page traffic. Combined, average order value moved from ~$75 to $107.16 vs the prior quarter.
Are these numbers verifiable, and what’s the data source? Headline figures (9.8% CVR, $691K revenue, 7,100 orders, 72,200 completions, 75.2% completion rate) come from the Built for Shopify RevenueHunt Analytics dashboard, which attributes orders directly against Shopify’s order ledger rather than against the Meta Pixel or GA4. That is the same first-party attribution model used across the platform benchmark report (45M+ responses, $370M+ attributed revenue across 20,000+ stores).
Next steps
- See if the model fits your category in the beauty solutions overview.
- Read the pillar argument behind this case study: quiz funnels vs collection pages, why your paid traffic bounces.
- Estimate the impact on your own AOV with the quiz ROI calculator.
- Launch a quiz on Shopify (no code, free trial).
Free tools & data
Put these benchmarks to work on your own store.
Free tool
Quiz ROI calculator
Estimate the extra revenue and ROI a product recommendation quiz could add to your store. Built on real data, no email required.
Calculate your ROIFree report
Ecommerce quiz benchmark report
How product recommendation quizzes really perform: conversion by category, AOV uplift, and completion, from 45M+ real quiz responses.
Read the report

Most shoppers leave because they can't find the right product