First-party Shopify quiz analytics: why third-party tracking misses revenue
Pixel and GA4 miss 20-40% of orders. The Built for Shopify Analytics dashboard tracks every order at the source, plus the GA4 and Shopify Legacy setup paths.
Open GA4, Meta Ads Manager and Shopify’s dashboard at the same time and you’ll see three different stories about the same week. One reports 400 quiz-attributed conversions, another insists it’s 270, the third can’t decide. None of them is lying. They’re all using third-party tracking under increasingly hostile conditions: Apple’s App Tracking Transparency, Safari’s Intelligent Tracking Prevention, EU consent banners, and the 40%+ of shoppers running an ad blocker. Pixel and GA4 still matter for building audiences and understanding traffic sources. They’ve stopped being trustworthy for revenue attribution.
The customer who completed your quiz, on the other hand, isn’t anonymous. They told you their skin type, their budget, their concern. That conversation lives inside Shopify’s own database. The numbers you read off the Analytics dashboard inside the Built for Shopify version of the RevenueHunt app come straight from there: no pixel fires, no model-based attribution, no cookie consent dependency. (“Built for Shopify” is Shopify’s highest performance and quality designation for apps; it replaces the original RevenueHunt Shopify app as the default install.) This guide covers why third-party attribution is breaking, what’s inside the Analytics dashboard, and the Quiz Copilot AI explainability that no third-party tool can replicate.
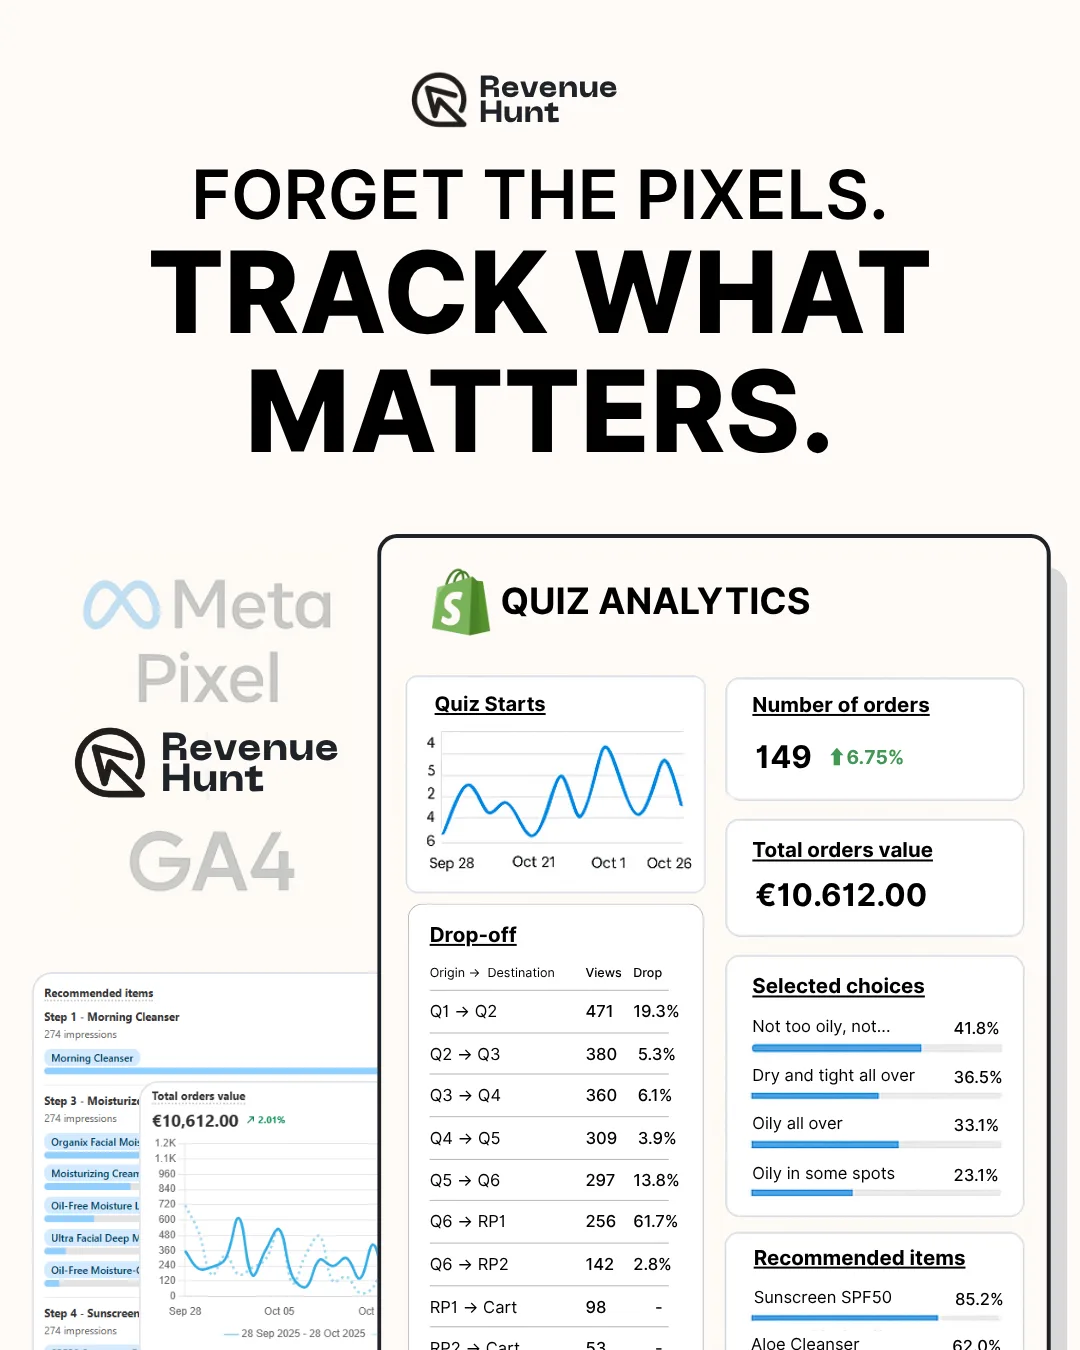
Fig. 01 First-party Shopify quiz analytics: numbers read straight from Shopify Orders, no pixel fires, no model-based attribution, no cookie consent dependency. What the customer told you in the quiz lives next to what they bought.
What you'll learn
- →The four structural reasons Pixel and GA4 under-report quiz revenue: ATT, ITP, consent loss, ad blockers.
- →Why first-party data from a quiz is structurally different (and better) for revenue attribution.
- →What's actually inside the RevenueHunt Analytics dashboard: cards, drop-off, result visibility, customisable layouts per team member.
- →Quiz Copilot AI: how Analyze Response makes every recommendation explainable.
- →When Pixel and GA4 are still the right tool (they are, just not for revenue attribution).
The third-party attribution gap
Why your Pixel and Shopify revenue figures don't match
~30%
drop in Meta-reported conversions after iOS 14.5+ App Tracking Transparency took effect (Meta, 2021 onward)
~40%
of global web visitors run an ad blocker, which strips Meta Pixel and GA4 tags at the network layer (Backlinko)
7 days
maximum first-party cookie lifetime on Safari (Intelligent Tracking Prevention); anything longer-tail drops out of pixel attribution windows
Four structural forces are eating third-party revenue tracking from different angles, and the effect compounds. Here’s what each one does, with concrete numbers.
Apple’s App Tracking Transparency (iOS 14.5+, 2021) asks every iOS user whether each app can track them across other apps and sites. Roughly 75-85% of users say no. Meta’s own published guidance walked advertisers through a 20-35% drop in reported conversions in the months after ATT shipped, and the gap has stayed close to that range ever since. The Pixel still fires; it just can’t connect ad clicks to purchases when the user opted out, so those purchases never appear in Meta’s reporting.
Safari Intelligent Tracking Prevention (ITP) caps first-party cookies set by tracking scripts at 7 days. Past that, the cookie that Pixel or GA4 dropped on the shopper’s first visit is gone, and the next visit looks like a brand-new user. In practice this collapses any attribution window longer than a week. Across RevenueHunt’s 2026 benchmark dataset, 1 in 5 quiz-attributed orders lands more than 30 days after the quiz. On Safari, none of those orders attribute back to the original quiz session under Pixel or GA4, but they all do under Shopify’s first-party order data.
Cookie consent loss kills GA4 client-side reporting in Europe and increasingly under US state privacy laws. Industry reports put EU opt-out rates around 30-40%, depending on country and consent UI. When the shopper rejects cookies, GA4 either runs in restricted measurement mode (the Consent Mode v2 fallback) or doesn’t run at all. Conversions still happen; they just don’t enter your analytics.
Ad blockers block Meta Pixel and GA4 scripts at the network layer before either has a chance to fire. Backlinko’s industry tracking puts global ad-blocker adoption at 42.7% as of 2025, higher on desktop than mobile. Visitors who use uBlock Origin or any standard list don’t appear in your Pixel or GA4 data at all.
Stacked, these four forces typically mean Pixel and GA4 see 60-80% of the conversions that Shopify Orders sees. The 20-40% gap is where the “GA4 says 270, Shopify says 400” reconciliation pain lives.
First-party data is structurally different
A first-party quiz response isn’t subject to any of the above. When a shopper completes a product recommendation quiz for Shopify, the customer signs in (consent given), takes the quiz (data declared willingly), and the response gets stored on your Shopify infrastructure with their consent. That same response is then attached to whatever Shopify order the customer places, by Shopify’s own customer ID, not by a probabilistic cookie match.
The structural change matters for marketing, not just analytics. Zero-party data (what the customer explicitly told you) and first-party data (what they did on your store) are the only categories of customer data that survive the privacy transition intact. For the broader strategy this connects to, see our zero-party data guide and first-party data guide; for the activation playbook on the data this dashboard exposes, see your Klaviyo list is a graveyard; for the lead-capture pillar this whole architecture rests on, see why popups are walls and quizzes are doors.
The anti-ageing device case study is the cleanest worked example in the cluster: 9.8% quiz-to-purchase conversion on cold Meta traffic, +42.64% AOV lift, $691,128 in attributed revenue across 90 days, all verified against Shopify Orders through this dashboard rather than Pixel or GA4.
Platform support for quiz revenue tracking
The first-party advantage applies most cleanly on Built for Shopify, but every RevenueHunt platform has a path to revenue attribution. The matrix below covers what’s native, what needs setup, and where GA4 is the right tool.
| Platform | Native Shopify revenue attribution | GA4 fallback |
|---|---|---|
| Built for Shopify | Yes, automatic on install. Analytics tab + Orders tab tagged natively. | Optional, for granular detail (traffic source, delayed attribution, cohort). |
| Shopify Legacy | Yes, manual setup. Same-session caveat applies (see Shopify Legacy section below). | Recommended for delayed orders. |
| WooCommerce, Magento | Not available (no native Shopify integration on these platforms). | Yes, GA4 only. |
| BigCommerce, Standalone | Not available. | Yes, GA4 only. |
The rest of this article walks each path: the Built for Shopify dashboard (next), the GA4 cross-platform setup, and the Shopify Legacy attribution model with its same-session caveat.
What’s in the Built for Shopify Analytics dashboard
Every quiz’s Analytics tab is the in-product surface for first-party measurement. It connects to Shopify Orders natively the moment the app is installed: no Connect-tab toggle, no consent flow, no Order Notes prerequisite. The Shopify Legacy setup and the cross-platform GA4 path are covered in their own sections below.
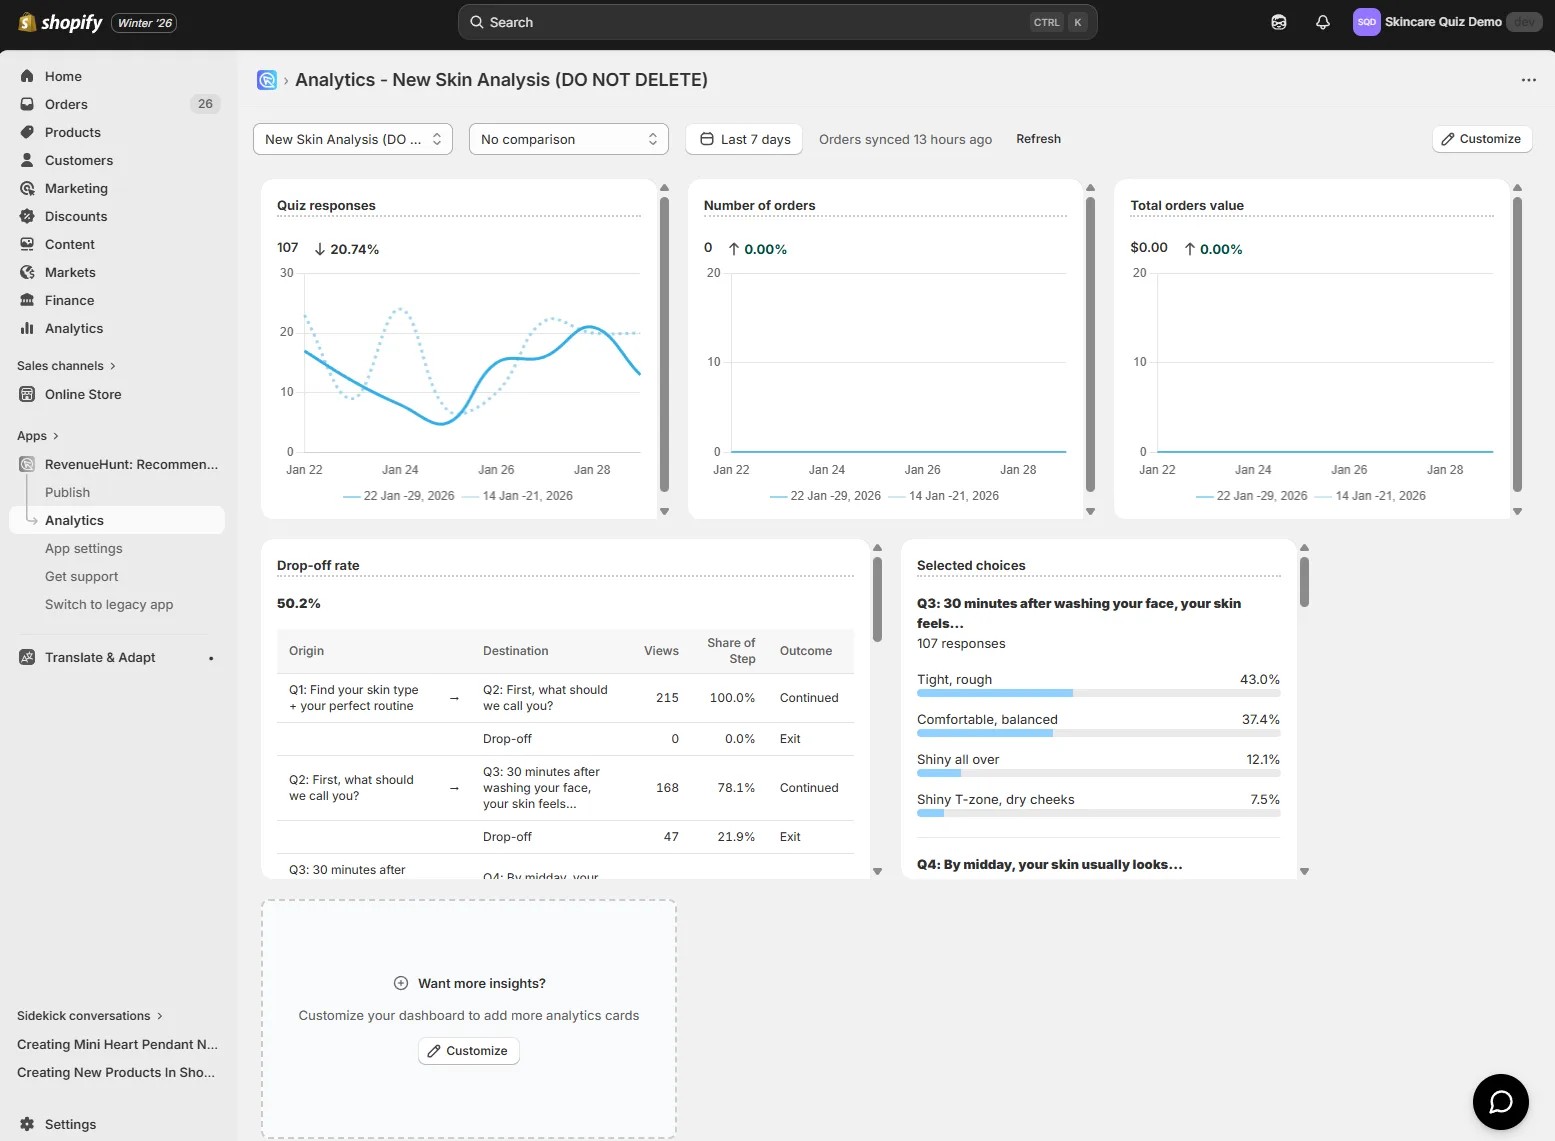
Fig. 02 The Analytics dashboard inside the Built for Shopify version of the app. Native Shopify Orders connection means revenue and orders sync on install with no Connect-tab toggle and no Order Notes prerequisite.
The four default surfaces:
Quiz Starts and Completions
Server-side counted on every quiz response. Ad blockers don’t change the number because the count happens on RevenueHunt’s infrastructure, not in a client-side script. The completion rate (response / start) gives you the live signal on quiz friction without waiting for GA4 to backfill.
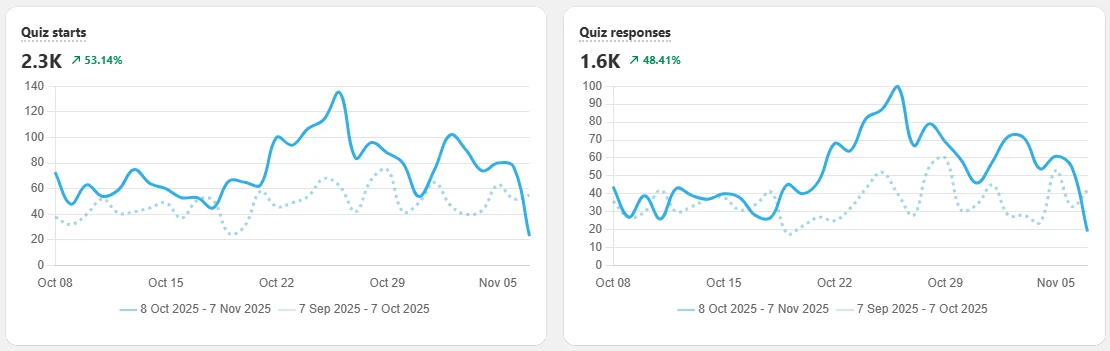
Fig. 03 Quiz starts and responses, counted server-side. Ad blockers do not affect the count because the increment happens on RevenueHunt's infrastructure rather than in a client-side pixel.
Orders and Revenue
Synced from the Shopify Orders table directly. Not estimated. Not modelled. The same numbers your accountant uses for revenue reporting, filtered to the customers who took your quiz. No “modelled conversions” or “data-driven attribution” black box.
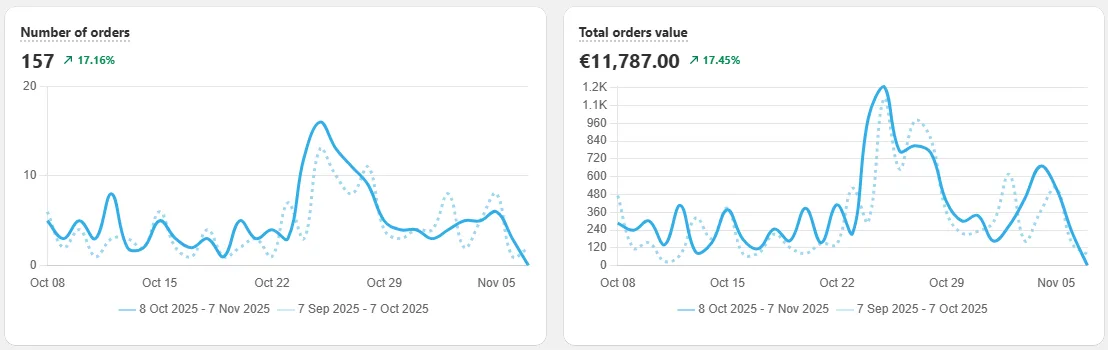
Fig. 04 Orders and revenue, synced directly from the Shopify Orders table. Same numbers your accountant uses for revenue reporting, filtered to the customers who took the quiz.
Drop-off per question
The single most actionable card on the dashboard. Every question shows the share of shoppers who left at that step. A spike on question 4 means rewrite question 4 (or move it later in the quiz). For the metric thresholds to compare against, see our product quiz metrics playbook.
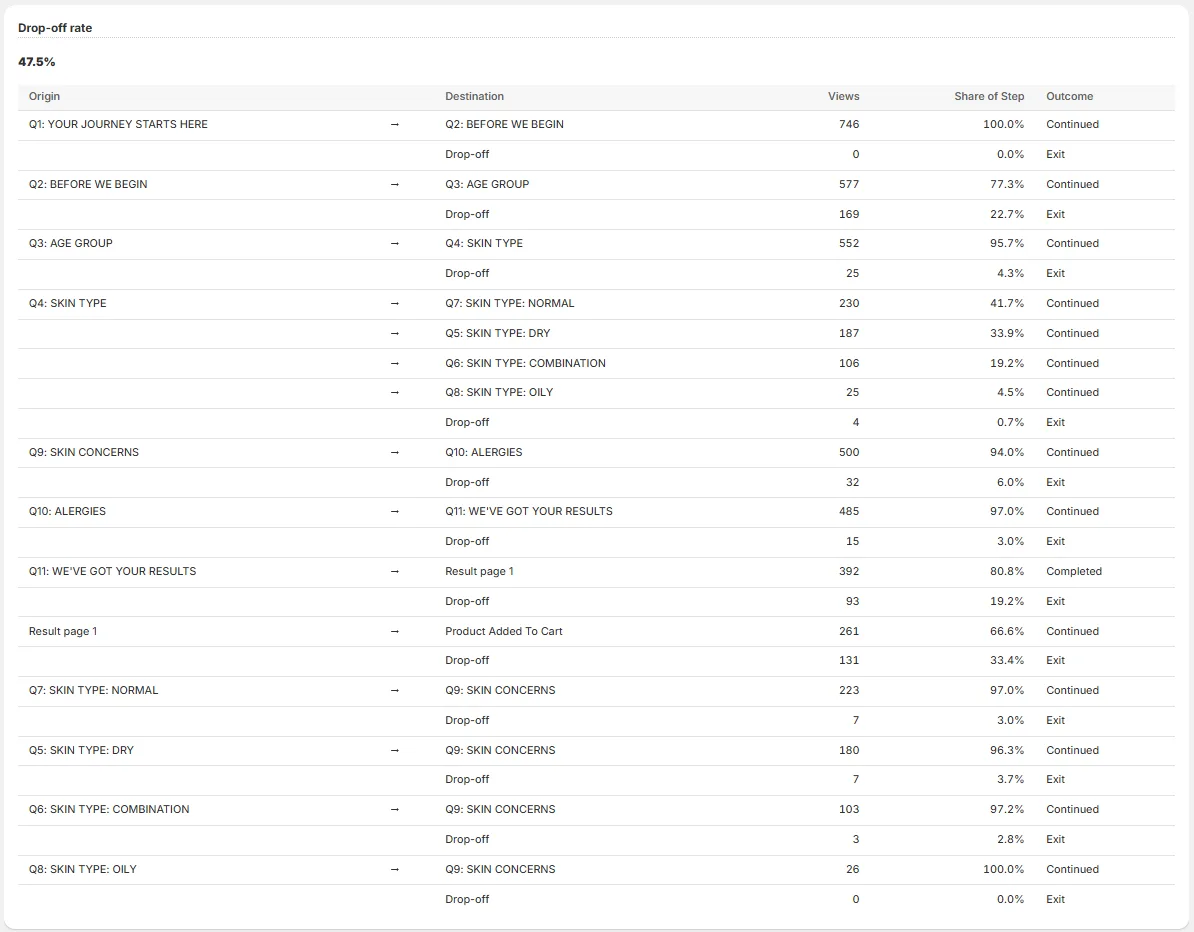
Fig. 05 Per-question drop-off chart. The single most actionable card on the dashboard: a spike on a specific question is a precise instruction to rewrite or reorder that question.
Result visibility
Which result sections actually appeared to shoppers, and which recommended products got clicked. Useful for catching display-logic configurations that filter so tightly nothing shows, or for spotting that one product gets a disproportionate share of recommendations.
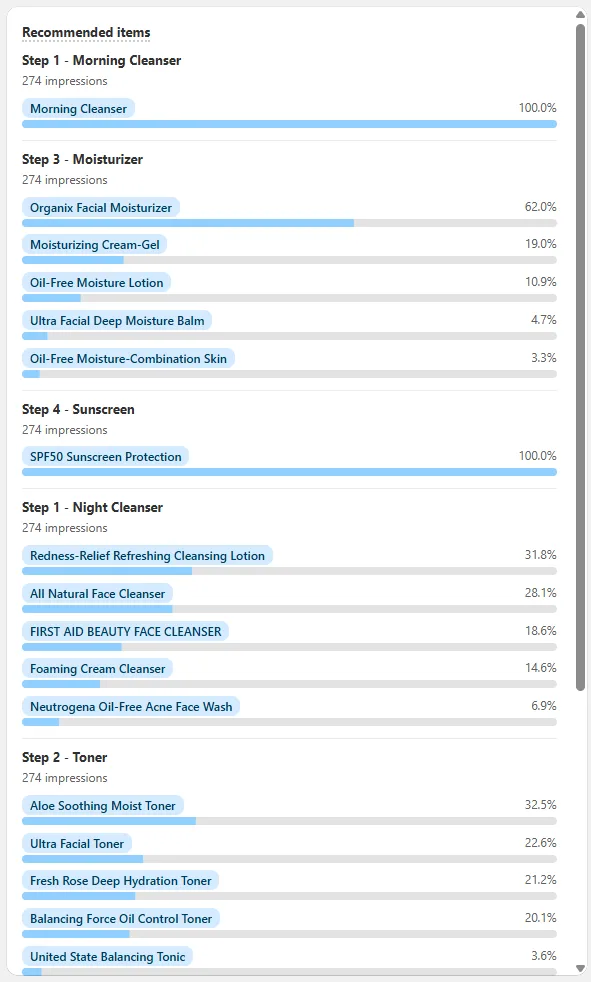
Fig. 06 Recommended items breakdown: which result sections appeared and which products got clicked. Useful for spotting display-logic configurations that filter so tightly nothing shows, or for catching one product hogging a disproportionate share of recommendations.
Quiz answers attached to every Shopify order
Every order that came through a quiz is automatically marked in your Shopify Orders tab on Built for Shopify. Open any of them and the quiz answers appear on the order record, so support, fulfilment and marketing can all see the customer’s stated preferences without leaving Shopify.
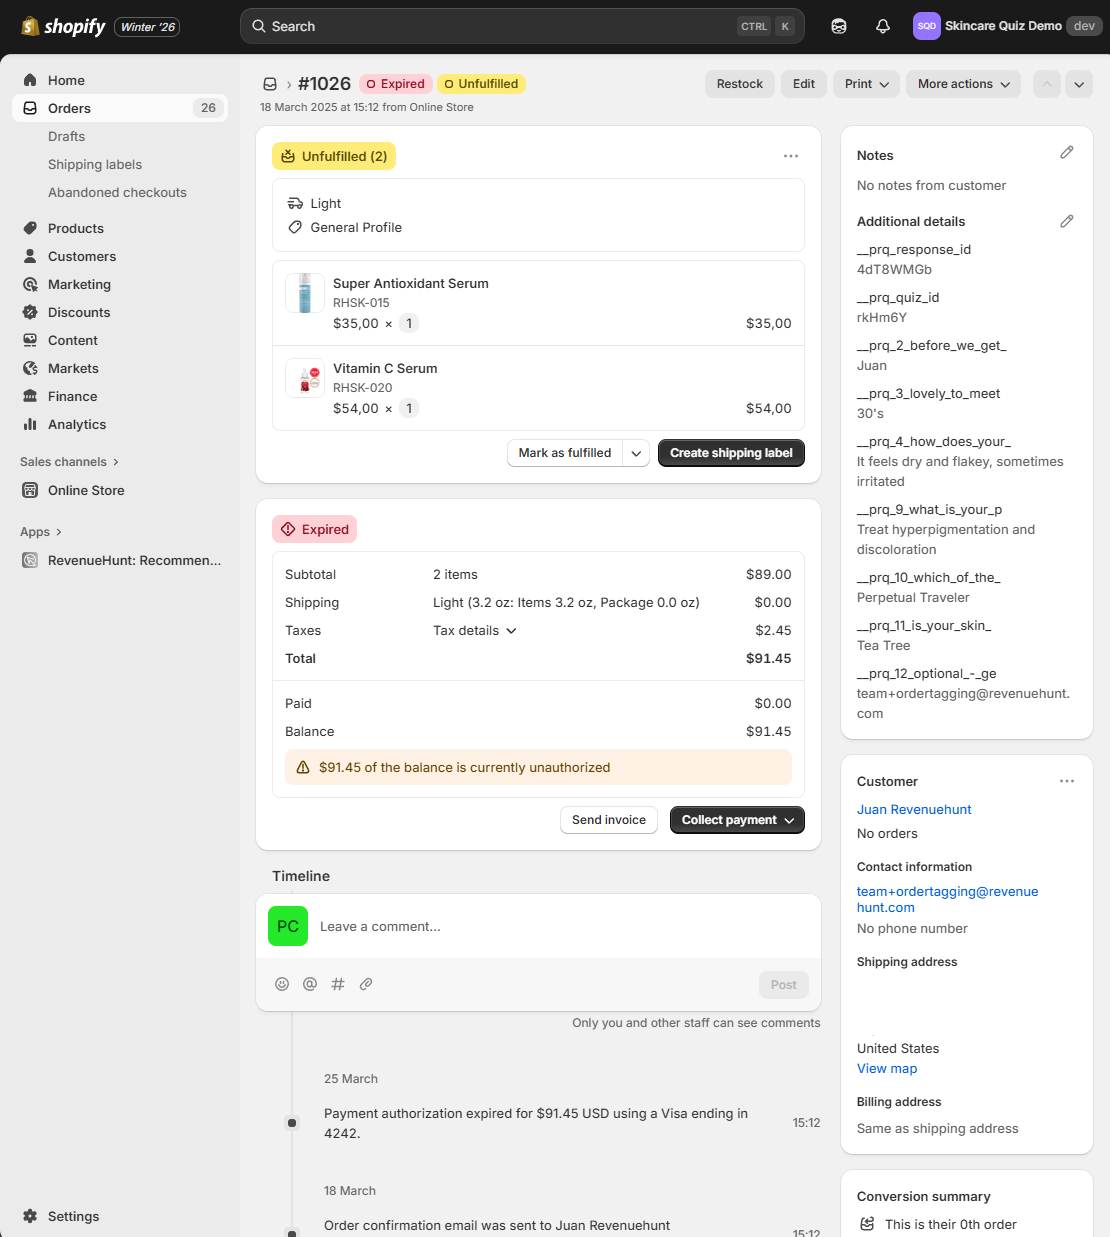
Fig. 07 Quiz answers attached to a Shopify order on Built for Shopify. The customer's stated preferences appear directly on the order record, so support, fulfilment and downstream segmentation all read the same source of truth.
This is the data layer that powers downstream segmentation. Pipe the same answers into Klaviyo, HubSpot or Omnisend and your post-purchase flows can address the stated concern rather than send generic “thanks for your order” copy.
Customise the dashboard per role
The dashboard isn’t a fixed layout. You add, remove and rearrange cards based on what your team needs to monitor, then save the layout. Different roles end up looking at very different views.
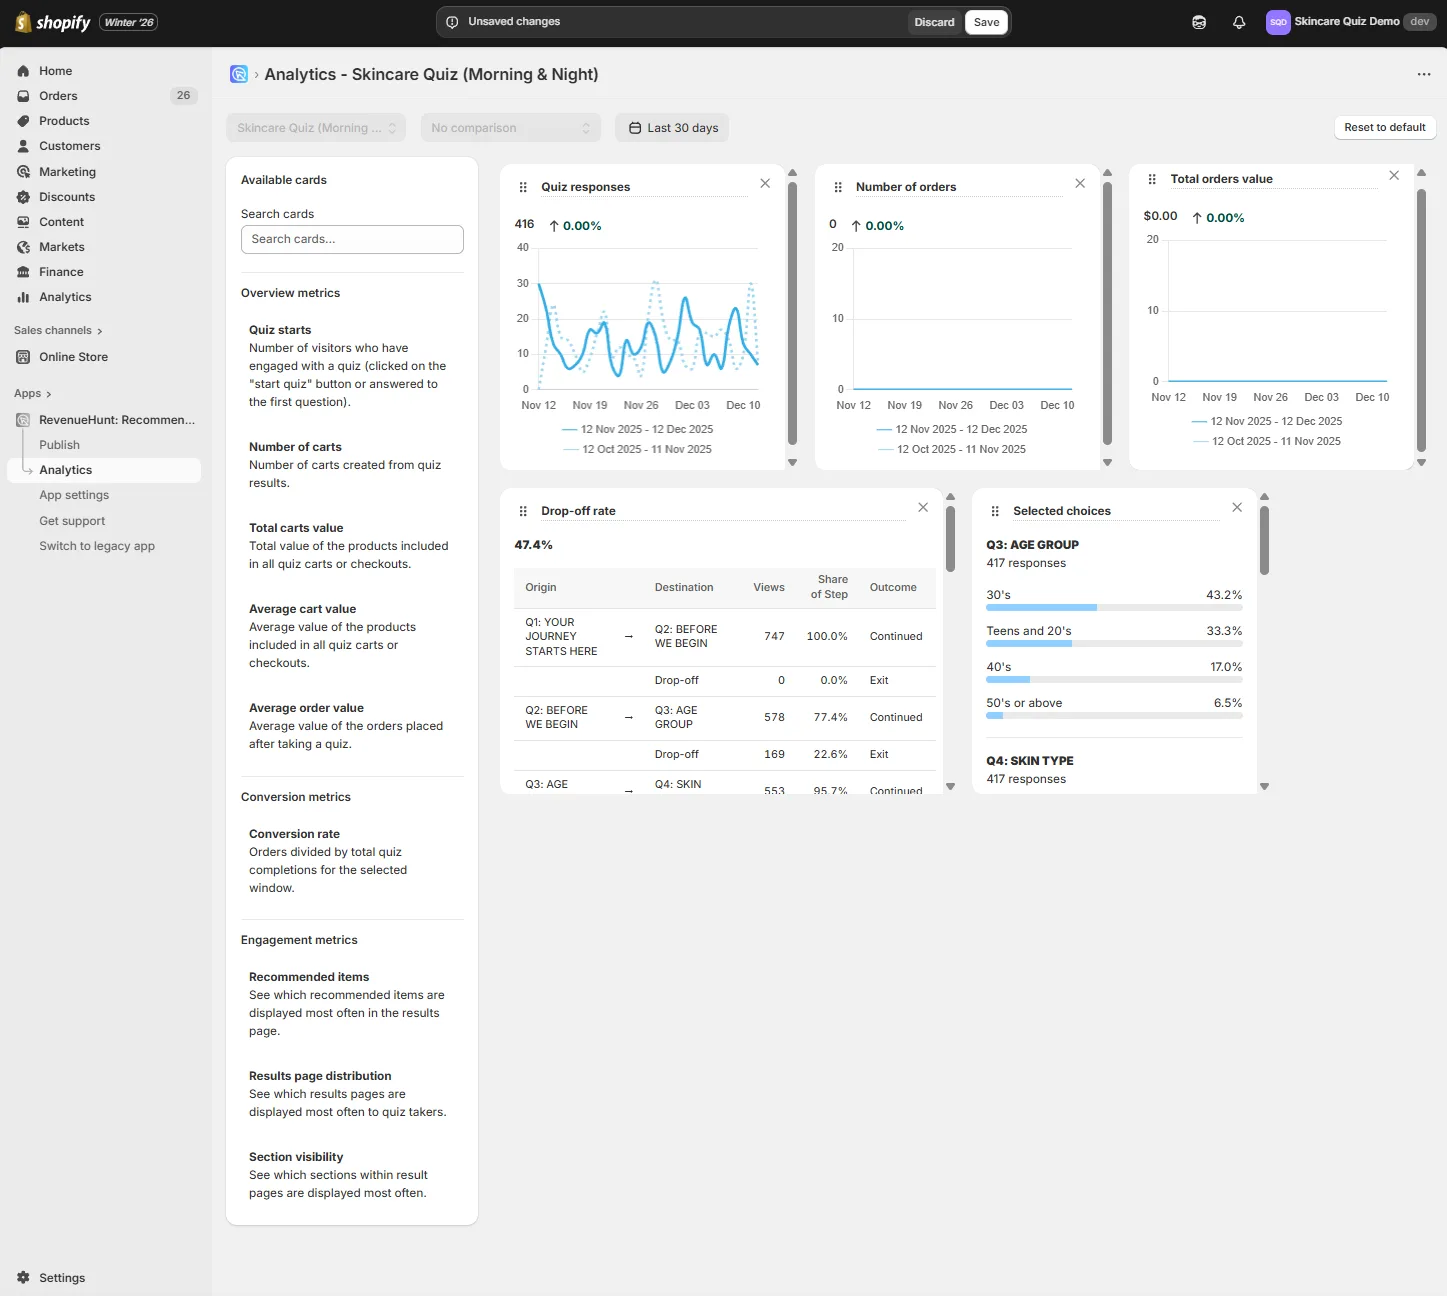
Fig. 08 The dashboard is customisable by role. Marketing watches drop-off and completion rate; merchandising watches recommended items and AOV; ops watches starts and responses. Layouts save per role.
For growth or engagement focus: pin Quiz Starts, Drop-Off Rate, Completion Rate.
For revenue reporting to leadership: pin Number of Orders, Total Carts Value, Average Order Value.
For a market launch: pin Results Page Distribution and Section Visibility to see whether the new audience matches the recommendations you designed for them.
Cards update live for quiz responses and on a daily cadence for Shopify order sync. Save the layout once and every team member opens straight to the view they need.
Quiz Copilot AI: explainability no third-party tool can replicate
The gap a third-party analytics tool can never close is explainability per response. GA4 can tell you that completion rate fell 4 points this week. It cannot tell you why a specific shopper saw the products they saw, or which choices triggered which recommendation rules.
RevenueHunt’s Quiz Copilot AI lives in the Responses section. Click any response and open Analyze Response to see:
- The exact recommendation rules that fired for that customer
- Which choices triggered which product conditions
- Which result sections were visible vs hidden, with the rule that hid them
- Why specific products appeared in slot 1 vs slot 4
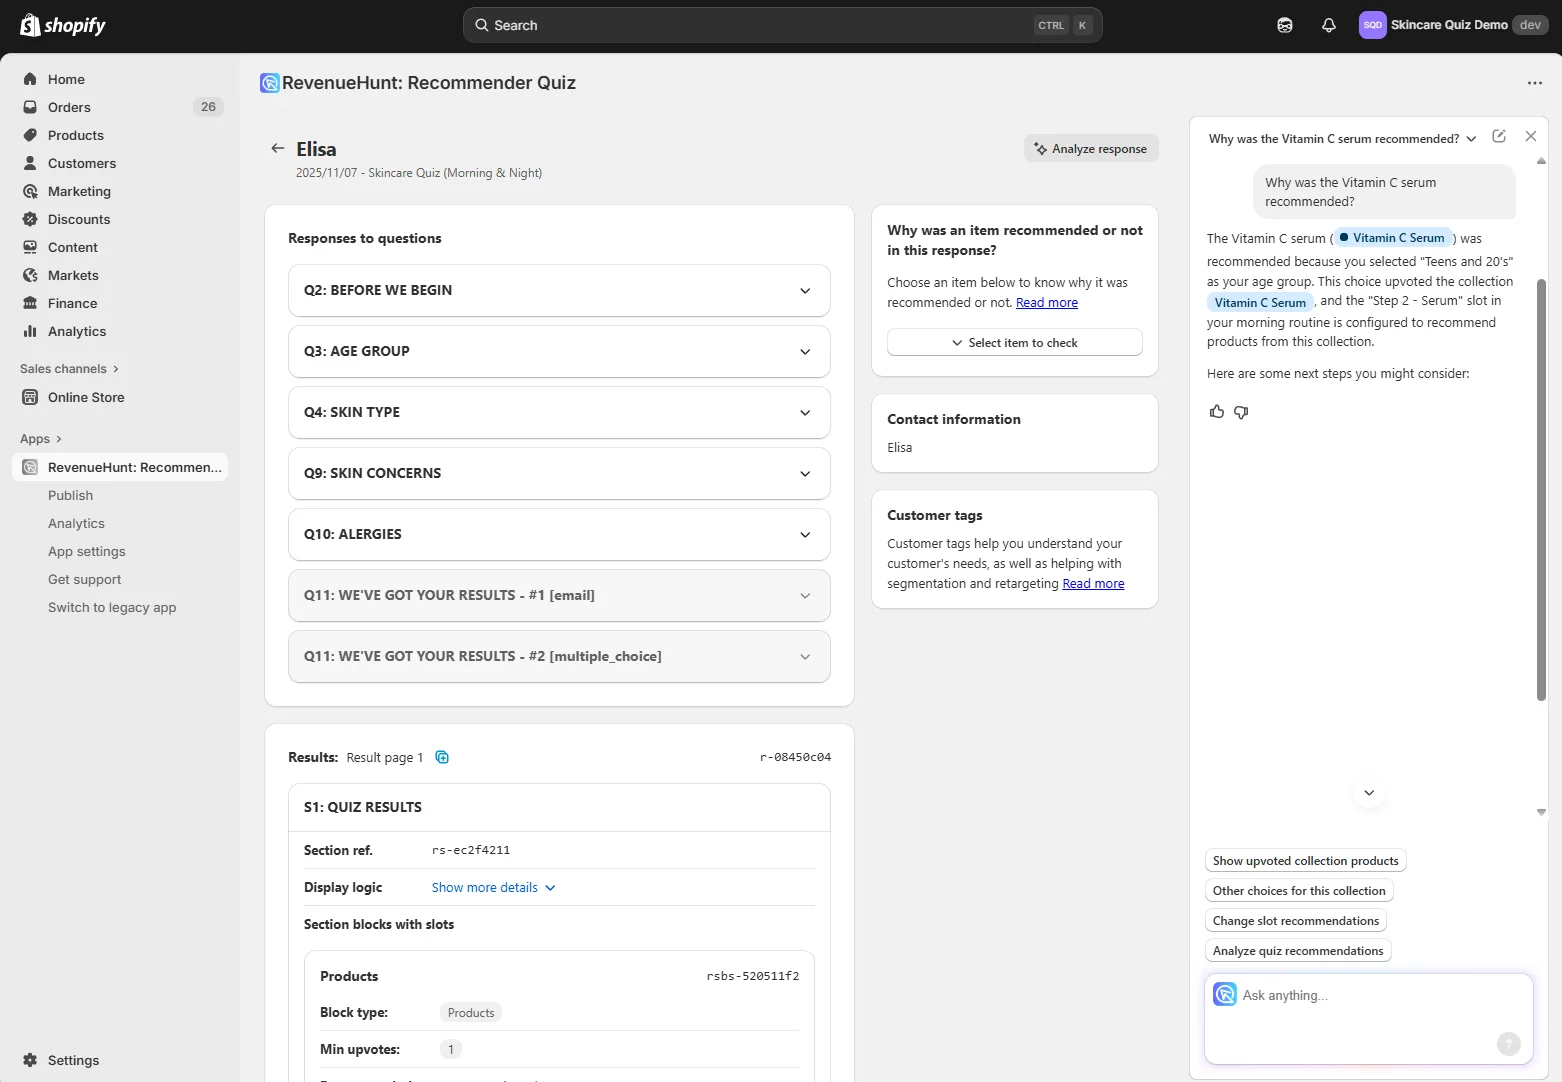
Fig. 09 The Analyze Response panel with Quiz Copilot explainability. Reads the quiz logic in plain English: which result sections were visible vs hidden and why, why specific products appeared in slot 1 vs slot 4. No third-party analytics tool can replicate this because it reads the quiz logic itself, not just events.
When a quiz underperforms, this is the diagnostic surface. Instead of guessing whether the conditions are too strict, you read the reasoning the engine actually applied. Marketers can hand that explanation to product, and product can reproduce the result deterministically.
When Pixel and GA4 are still the right tool
The argument here is not “delete your Pixel.” It’s “stop using it for revenue attribution.” Each tool has a job it does well, and the honest breakdown is:
| Tool | Use it for | Don't use it for |
|---|---|---|
| First-party (RevenueHunt Analytics + Shopify Orders) | Revenue attribution, drop-off, recommendation precision, explainability | Discovering new audiences cold |
| Meta Pixel | Lookalike audiences, retargeting quiz takers who didn't buy, ad delivery optimisation | Reporting revenue to leadership or paying yourself based on it |
| GA4 | Traffic-source attribution (which channel drove the quiz takers), delayed-attribution recovery on Shopify Legacy | First-touch revenue reporting or post-iOS-14 ad ROAS reconciliation |
The clean operating rule: first-party data is the source of truth for revenue. Pixel and GA4 are the source of truth for audiences and traffic. If your dashboards mix the two, you’ll spend half your week reconciling numbers that were never meant to match. For the paid-traffic version of this argument (how the same signal-loss spiral compounds CPM inflation when a collection page is the ad destination), see quiz funnels vs collection pages.
Cross-platform tracking via GA4
Even on Built for Shopify, GA4 is worth adding once revenue starts to matter. The native Shopify integration is the daily “did the quiz produce a sale today?” check. GA4 answers the harder questions: which traffic source drove the highest-value quiz takers, which question is the biggest drop-off point, and what does the path to purchase look like for someone who took the quiz two weeks ago.
GA4 is also the only revenue layer available on WooCommerce, Magento, BigCommerce and Standalone, which don’t have a native Shopify-style integration.
Setup steps
- In the RevenueHunt app, open the Connect tab and find Google Analytics.
- In GA4, open Admin → Data Streams and copy your Measurement ID (format
G-XXXXXXX). - Paste the Measurement ID into RevenueHunt and save.
- Publish the quiz to activate tracking.
What you get in GA4
- Quiz starts, question views, completion rates
- Choices selected and products recommended
- Add-to-cart actions and checkouts
- Revenue from quiz-driven sales (Engagement → Conversions → Purchase, filter
source = revenuehunt)
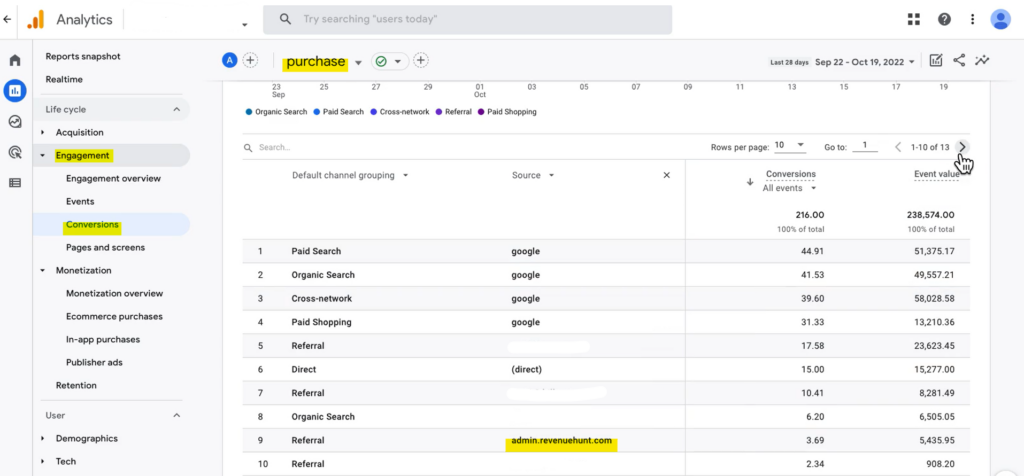
Fig. 10 The GA4 conversions report filtered by source = revenuehunt. Captures quiz-driven revenue across longer attribution windows than Pixel can hold, and works identically on every RevenueHunt platform.
For advanced custom events (firing your own gtag calls for specific choices or answer combinations), embed the prqQuizCallback function in your theme.
Setting up revenue tracking on Shopify Legacy
On the Shopify Legacy app, revenue attribution is opt-in and has a behavioural constraint that’s easy to overlook. Read the warning first, then the setup.
Critical caveat
On Shopify Legacy, Shopify Revenue Tracking and Orders Tagging only attribute a purchase to the quiz if the customer (a) adds products to cart directly from the quiz results page, (b) proceeds immediately to cart after the quiz, and (c) completes the purchase in the same session. Delayed purchases (next day, after an email, after re-engagement) will not be attributed. Your Results Page Checkout setting must be proceed to cart, not proceed to checkout or link to product. If most of your sales close on a later visit, route the delayed-attribution case through GA4 (above) instead.
Setup on Legacy
- Enable Order Notes in your Shopify Theme Settings (the integration uses Order Notes as the data carrier). Follow Shopify’s instructions or ask your theme developer.
- In the RevenueHunt app, open the Connect tab and find Shopify Revenue Report. Click Connect.
- Grant consent when prompted. This authorises the app to read your order data.
- Click Publish in the top-right to apply the changes.
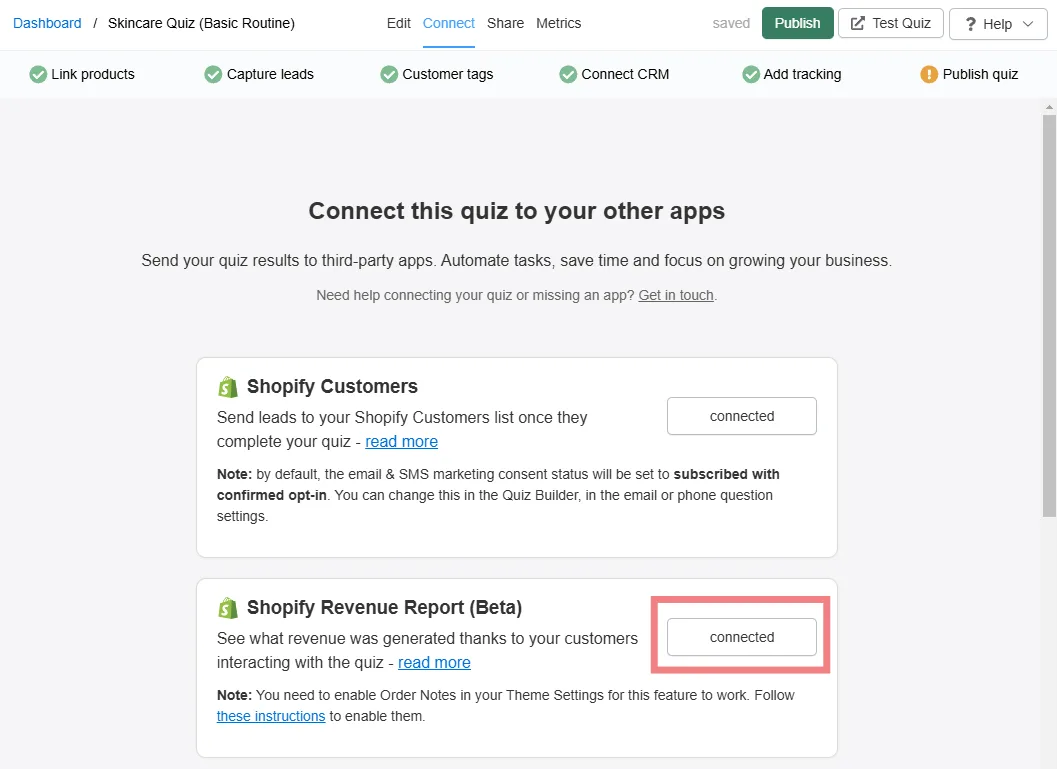
Fig. 11 The Shopify Revenue Report Connect button in the Quiz Builder Connect tab on Shopify Legacy. One-time setup per quiz; once connected, revenue cards appear in the Analytics dashboard.
View the data on Legacy
Once connected, Metrics → Analytics in the RevenueHunt app shows Number of Orders, Total Orders Value and Average Order Value, all subject to the same-session caveat above.
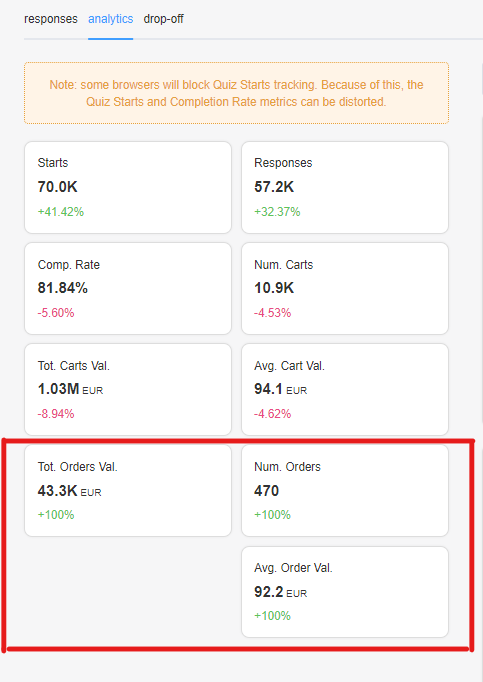
Fig. 12 The Analytics dashboard on Shopify Legacy after revenue tracking is connected. Same cards as Built for Shopify (orders, total value, AOV), but the underlying numbers only include same-session purchases.
Quiz answers in Orders on Legacy
Legacy also supports surfacing quiz answers on the Shopify order record, but it’s a separate toggle in the Connect tab (look for Shopify Orders Tagging). The mechanic is the same as Built for Shopify once enabled. See the docs page on showing quiz answers in orders for the per-platform walkthrough.
Quick playbook: access and use your quiz data
-
Open your analytics. RevenueHunt dashboard → pick your quiz →
...→ Analytics. Use the date selector to pick a window.
Fig. 13 Opening the Analytics dashboard from the quiz menu. The date selector is the first control to set: most useful comparisons read a 30-day window vs the previous 30 days.
-
Customise your dashboard. Click Customize, add or rearrange cards (Quiz Starts, Completion Rate, Drop-Off Rate, Orders, Total Cart Value, AOV, Results Page Distribution, Section Visibility, Recommended Items). Save the layout per role.
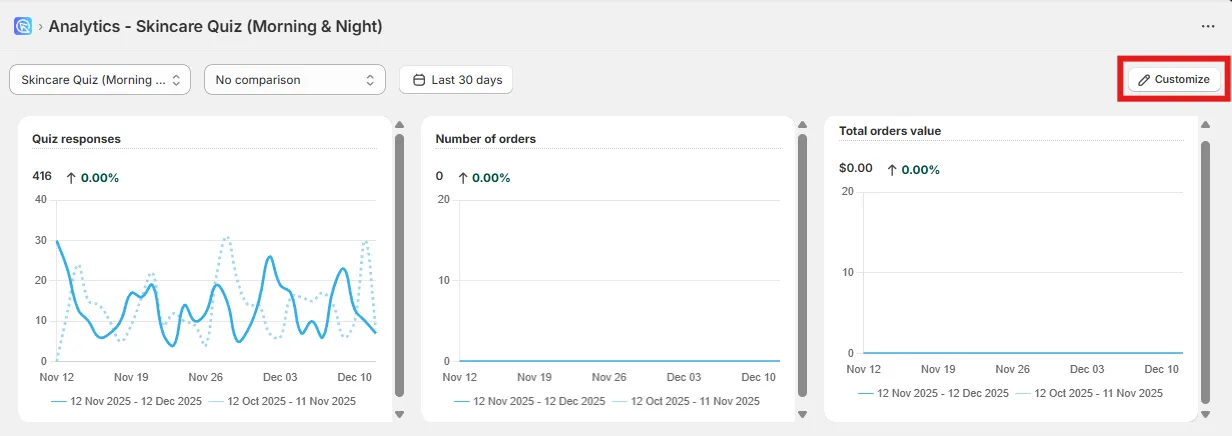
Fig. 14 The Customize button opens the layout editor. Add, remove or rearrange cards (Quiz Starts, Completion Rate, Drop-Off Rate, Orders, Total Cart Value, AOV, Results Page Distribution, Section Visibility, Recommended Items) and save the layout per role.
-
Dig deeper with Responses. Quiz menu → Responses → View → Analyze Response to see each shopper’s path, choices, and which products were (or weren’t) recommended.
Fig. 15 Opening the Responses panel for row-level analysis. View any response, then Analyze Response to see each shopper's path, choices and the products that were (or were not) recommended.
- Act on what you learn. Simplify slides with high drop-off. Tighten or loosen the rules surfaced by Quiz Copilot. Use customer tags to feed segmented follow-up email.
That’s the loop. Everything you need to understand, improve and grow quiz performance lives inside the Built for Shopify app, with the source of truth coming from Shopify Orders directly.
FAQ
Does the Built for Shopify dashboard replace Pixel and GA4?
No, and that’s not the point. Pixel is the right tool for audience building and retargeting, GA4 for traffic-source attribution. The Built for Shopify dashboard is the right tool for revenue attribution, drop-off, and explaining recommendation logic. Run all three; just don’t mix what they’re for.
How often does the dashboard data refresh?
Quiz responses update live. Shopify order sync runs on a daily cadence. Custom date ranges work the same way; pick a window and the cards re-aggregate.
What about Shopify Legacy attribution?
Legacy has a same-session attribution caveat (the customer has to add to cart from the results page and proceed to checkout in the same session) that doesn’t apply on Built for Shopify. If you’re on Legacy and most of your sales close on a later visit, lean on GA4 for the delayed-attribution recovery and treat the Built for Shopify approach as the goal once you migrate. The Shopify Legacy section above walks the setup and the GA4 section covers the delayed-attribution recovery.
Why does Pixel under-report quiz revenue?
iOS App Tracking Transparency (~30% of conversions lost on iOS), Safari ITP (7-day cookie cap collapses delayed attribution), cookie consent loss in EU (30-40% opt-out), and ad blockers (42% global) compound. The Pixel still fires; it just can’t see the conversions on the other end. First-party data isn’t subject to any of those constraints because the data path doesn’t depend on cross-site tracking.
Can each team member save a different dashboard layout?
Yes. Cards and layouts are customisable, and saved layouts persist. A growth manager, a designer and a founder can each open the dashboard to their own view of the same underlying data.
Can I see which Shopify order came from which quiz answer?
Yes, on both Built for Shopify and Shopify Legacy. On Built for Shopify the quiz answers appear on the Shopify order record by default. On Legacy you enable Shopify Orders Tagging in the Connect tab and the answers attach the same way. Support and fulfilment can read the stated preferences without leaving Shopify.
Does revenue tracking work on WooCommerce, Magento, BigCommerce or Standalone?
No native Shopify-style revenue layer exists on those platforms (they’re not Shopify), but the GA4 integration works on all of them. Set the Measurement ID in the Connect tab and revenue lands under Engagement, Conversions, Purchase in GA4, filtered by source = revenuehunt.
Should I run native Shopify tracking and GA4 together?
On Built for Shopify, often yes. The native Shopify integration is the daily “did the quiz work today” check; GA4 handles delayed attribution, traffic-source attribution, and cohort analysis that the Shopify Analytics tab doesn’t cover. On Shopify Legacy with the same-session caveat, treating GA4 as the source-of-truth is usually safer.
Next steps
- For the data category this all rests on: zero-party data guide and first-party data guide.
- For the ad-side audiences Pixel is genuinely good at: Meta Pixel quiz integration.
- For the metric thresholds to compare your dashboard against: product quiz metrics.
- For what makes the Built for Shopify app different from Legacy: RevenueHunt is Built for Shopify.
- Estimate the revenue lift on your own store: quiz ROI calculator.
- The benchmark report behind every platform stat in this article: the state of product recommendation quizzes.
Free tools & data
Put these benchmarks to work on your own store.
Free tool
Quiz ROI calculator
Estimate the extra revenue and ROI a product recommendation quiz could add to your store. Built on real data, no email required.
Calculate your ROIFree report
Ecommerce quiz benchmark report
How product recommendation quizzes really perform: conversion by category, AOV uplift, and completion, from 45M+ real quiz responses.
Read the report

Most shoppers leave because they can't find the right product